L2023.11 Release Notes
Last updated: June 29, 2025
For a list of release dates and Sisense's end of support schedule, see Sisense Version Release and Support Schedule.
-
To download the latest Sisense version, or to upgrade to an older version, see that version’s Release Notes and contact your Sisense Customer Success Manager for the version package.
-
To upgrade to this version of Sisense:
-
Read the Release Notes of all the versions following your current version, up to and including the version to which you are upgrading.
-
Run a system backup before upgrading. See Backing up and Restoring Sisense.
-
Follow the upgrade procedure in Upgrading Sisense.
-
Privacy and Security Information
This release contains several security related updates. We highly recommend upgrading to this latest release to take advantage of any security-related updates and benefit from the Sisense support and warranty. In addition, Sisense strongly recommends regularly testing and auditing your environment after upgrading, and periodically during your subscription term, to ensure all privacy and security settings remain in place.
Customers are responsible for controlling and monitoring your environments and are therefore in the best position to ensure the correct security settings are in place for how you use Sisense products.
Due to the complexity of Sisense products, we strongly suggest that all customers ensure that you understand how all of the privacy and security settings within Sisense work.
If you use Sisense to store/process sensitive data, it is your responsibility to review and test your implementation to ensure you are not inadvertently sharing data with unauthorized third parties. For more information on data security rules, see Data Access Security.
BREAKING CHANGES - WARNING!
The following is a cumulative list of potentially breaking changes from approximately the past 12 months, and may also include warnings about upcoming changes:
An incompatibility issue has been identified which causes freezing in single-node environments due to high CPU usage reaching 100% (CPU Soft lock crash). Instances running on Ubuntu 20/22 with kernel versions >= 5.15 and < 6.7 were found to be affected. This issue can lead to system freezes and Sisense upgrade failures. To resolve this, upgrading the Linux kernel to version 6.7 on your on-prem instances is critical before upgrading Sisense. See this Sisense Community article for instructions on upgrading the kernel.
This release introduces a significant change to the location where Sisense audit logs are stored. Read below carefully if you rely on accessing audit logs directly.
Audit logs were previously stored in a single location: /opt/sisense/storage/audit. Starting with version L2023.11, audit logs are now stored within individual tenant directories for enhanced security and organization. They are now stored in: /opt/sisense/storage/tenants/<tenant_id>/audit.
Impact: This change is considered breaking for users who access audit logs directly at the old location. Your existing scripts or processes must be updated to reflect the new path.
Some browsers are potentially planning to disable third-party cookies. This deprecation may cause a breaking change in your solutions with embedded Sisense analytics, such as the user being redirected to the login page and the embedded solution not being loaded. To avoid this breaking change:
-
Use the same domain for the different apps and put it behind a specific path - this will make Sisense cookies not be third-party cookies.
For more information, see Third-Party Cookies.
Due to significant architectural changes required to deliver Viewpoints, after upgrading to version 2023.11 or newer, customers using Infusion Apps may experience unexpected behaviors, such as Views not able to be published from dashboards, Views not working within the Infusion Apps, etc.
To avoid or mitigate these issues requires additional upgrade steps specific to Infusion Apps. Contact Support for assistance.
As of November 2023, the Quest add-on no longer supports displaying Narratives as part of the Quest widget header information. Make sure to redesign and validate your implementation with the use of the native Narratives capabilities by that time.
Release Overview
Release L2023.11 provides a number of new improvements to Sisense for Linux.
This release also includes a service update for L2023.11. See the L2023.11 Service Update 1 section below for details.
What's New
This release contains several new features. The following table lists the high-level impact (or potential impact, if any) of each of these features, and how to handle it if upgrading to this version. Continue reading the Release Notes below the table for a detailed explanation of each feature.
| Feature | Issues and Actions to Consider |
|---|---|
|
When this functionality is enabled, the new flow is applied to all shared dashboards, including dashboards with only one or with multiple owners. As long as a dashboard has been shared (with any permissions) to other users, the owner(s) will now have access to:
When a dashboard is shared with other users as co-owners, they get the same dashboard management rights as the original owner, (i.e., full access). See Limitations for a list of the limitations of this beta. |
|
| Infusion Viewpoints - Viewpoint Management |
The View Management page has been replaced with Viewpoint Management. The (legacy) Views created using dashboards/widgets are not displayed on the Viewpoint Management page. To locate a dashboard’s Views, open the dashboard directly. |
|
Infusion Viewpoints - Multitenancy Support for Viewpoints |
For Sisense deployments that are multitenant, and for which the Infusion Apps User has access to multiple tenants, users are required to provide the instance URL for the tenant they are attempting to log in to. |
|
Table and Pivot widgets based on Live models can now present data with a date and time resolution down to 1 second. |
|
|
|
Dashboard Co-Authoring (Beta)
Dashboard Co-Authoring enables multiple users or groups of users to manage, design and publish changes to the same dashboard as co-owners.
Note:
To enable Dashboard Co-Authoring (as an Admin): Admin tab > Feature Management (under App Configuration) > turn on the Dashboard Co-Authoring (Beta) toggle.
When this feature is enabled, all published dashboards (existing and newly published) will use the new co-authoring flow:
-
Co-owners - Dashboard can have one or more co-owners with full management access. In addition to any group co-owners, there must always be at least 1 individual user (not a viewer) co-owner.
-
Dashboard - Each co-owner (or the individual owner, if there is a single owner) gets access to 2 copies of a dashboard:
-
Shared version - Created based on the original owner’s copy. There is only one instance of this shared dashboard. This shared version can be accessed by all co-owners (one at a time). This dashboard is used for propagating the dashboard updates (when it is published) to all user copies of the dashboard.
-
Private copy - A separate private copy is available to each co-owner individually. This copy can be used for working with the dashboard privately as a consumer while the shared (“source”) version of the dashboard is being edited by one of the other co-owners. Changes made in private mode do not affect the shared version or any other user’s copy. This copy is updated whenever the shared version is republished.
-
For more information about Dashboard Co-Authoring, see Changing Ownership of a Dashboard.
Switching between Shared and Private
To edit a co-owned dashboard, a co-owner can use the Private/Shared toggle to switch to the shared version. Only one co-owner can work with the shared version at a time. When a co-owner is editing the shared version, it is locked (and the toggle is disabled) for the other co-owners. The shared version is unlocked whenever the co-owner switches to their private version (using the toggle), to another application page, logs out, or when a 4 hour timeout is reached.

Co-owners are notified about a shared version’s locked/unlocked status when they open a dashboard, when refreshing the page, or when trying to enter shared mode. (Real-time notifications are not yet supported.)
Adding Co-owners to Dashboard
A co-owner (or the single individual owner) of a dashboard can add co-owners by using the new permission Make Co-Owner in the dashboard share popup:

Groups can be added as co-owners (except the Everyone group). However, there is no validation to check whether all the users in the group have at least the designer role. Users with a viewer role will only see the viewer version of the dashboard, even if the group they belong to has been granted co-owner permissions.
Administrators can unlock any locked dashboards and update the dashboard shares (for example, to add more co-owners).
Dashboard Actions
Many of the dashboard actions, such as duplicate, export, download, and so on, can be triggered for each dashboard copy (private and shared) separately. Some actions are only available for the shared version: rename, republish, and delete.
This is reflected in the dashboard menu in the navigation panel, or from the Analytics page tile:

Importing Dashboards
When importing and overwriting a co-authored dashboard, the user can select whether to overwrite the private copy or the shared version.

For more information on importing dashboards, see Importing a Dashboard.
Analytics Tab
The Analytics tab now includes a Co-owned by me filter, and hovering over the dashboard displays the list of co-owners, (only the first 5 are displayed).

API Changes
-
New parameter
sharedMode=truewas added for working with the shared version of a co-authored dashboard. -
If no parameter is provided the request will be performed for the private copy, (
sharedMode=falseis ignored). -
The
sharedMode=trueparameter is NOT used in the following APIs: share/publish, lock, unlock, change_owner. These actions are only performed for the shared version.
Limitations
-
Re-enabling the feature (after it was previously enabled and then disabled) will result in losing all the changes in the owners’ dashboards that were made between disabling and re-enabling dashboard co-authoring.
-
Git integration is not supported for co-authored dashboards.
-
Dashboard co-authoring does not work correctly if the Dashboard and Widget Deltas structure is activated.
-
Notebooks C2D is not supported for co-authored dashboards.
-
Pulse alerts are not supported for co-authored dashboards.
Infusion Viewpoints
Infusion Viewpoints are independent data structures that are replacing the legacy Views, (which rely on dashboards and widgets). Viewpoints provide a robust management experience, have their own dedicated creation and editing workflow, and do not rely on dashboards and widgets.
Note:
(Legacy) Views will continue to work in all Infusion Apps.
Because Viewpoints do not rely on dashboards and widgets, they do not require the use of the Infusion Apps PublishView add-on. See Viewpoints for more information.
This release also includes a set of public REST APIs to better manage Viewpoints at scale.
Date-time Seconds Level Support
When the Analytical Engine is used for Live models the time-level support for widgets now supports an extended resolution of the data. This includes continuous (date and time) breakdowns of 1 second, 1 minute and 30 minutes for Table and Pivot widgets.

See Adding Widgets to a Dashboard for more information.
Related Time-Level Functionality
-
Exporting - Exporting to CSV and Excel (using the new export to Excel functionality) will include the seconds information in the exported data.
-
DIFF functions - When using data with seconds resolutions, DIFF functions for minutes will disregard the seconds and calculate the difference according to the minutes values only.
-
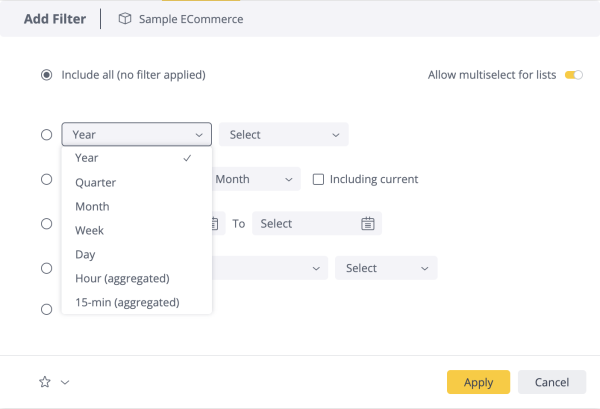
Filtering - When filtering dashboards or widgets, for both Live and ElastiCube data models, the following options are supported:
-
Continuous (date and time):
-
Year
-
Quarter
-
Month
-
Week
-
Day
-
-
Aggregated (aggregation taking into account only the time of day):
-
Hour
-
15 minute
-
Here is an example of the available filtering options:
-
-
Drilling - The following options are supported:
-
ElastiCube - ElastiCube widgets can drill down to 1 minute aggregation periods.
-
Live - Live widgets can drill down to 15 minute continuous (date and time) or aggregation (time of day only) reporting periods. In addition, Pivot widget can drill down to 1 second continuous or 1 minute aggregation periods.
-
Data Security - Multiple Rules
A new endpoint for creating multiple data security rules in live data models has been added. See https://developer.sisense.com/guides/restApi/v1/?platform=linux&spec=L2023.11#/elasticubes/addManyDataContextsForLiveElasticube
What's Improved
Add-ons
-
The Analyze with Insight Miner add-on now supports white labeling emails.
To enable white labeling for emails, download the new version of Insight Miner, configure a custom email server, (see Setting Up Custom Email Servers) and set{useCustomEmailServer:true}in the config fileplugins/analyzeWithInsightMiner/config.6.js. -
In Sisense version L2023.11 and Report Manager version 1.10.6, administrators can now set up access to the Report Manager for users with the Viewer role. When configured, Viewers will be able to:
-
View the Report Manager tab
-
Use event-based and time-based reports
-
Send reports to all users (both Sisense and external users)
You can find detailed information about configuring Viewer access in the Report Manager manual (the manual's link is provided in the Technical Details tab of this page).
-
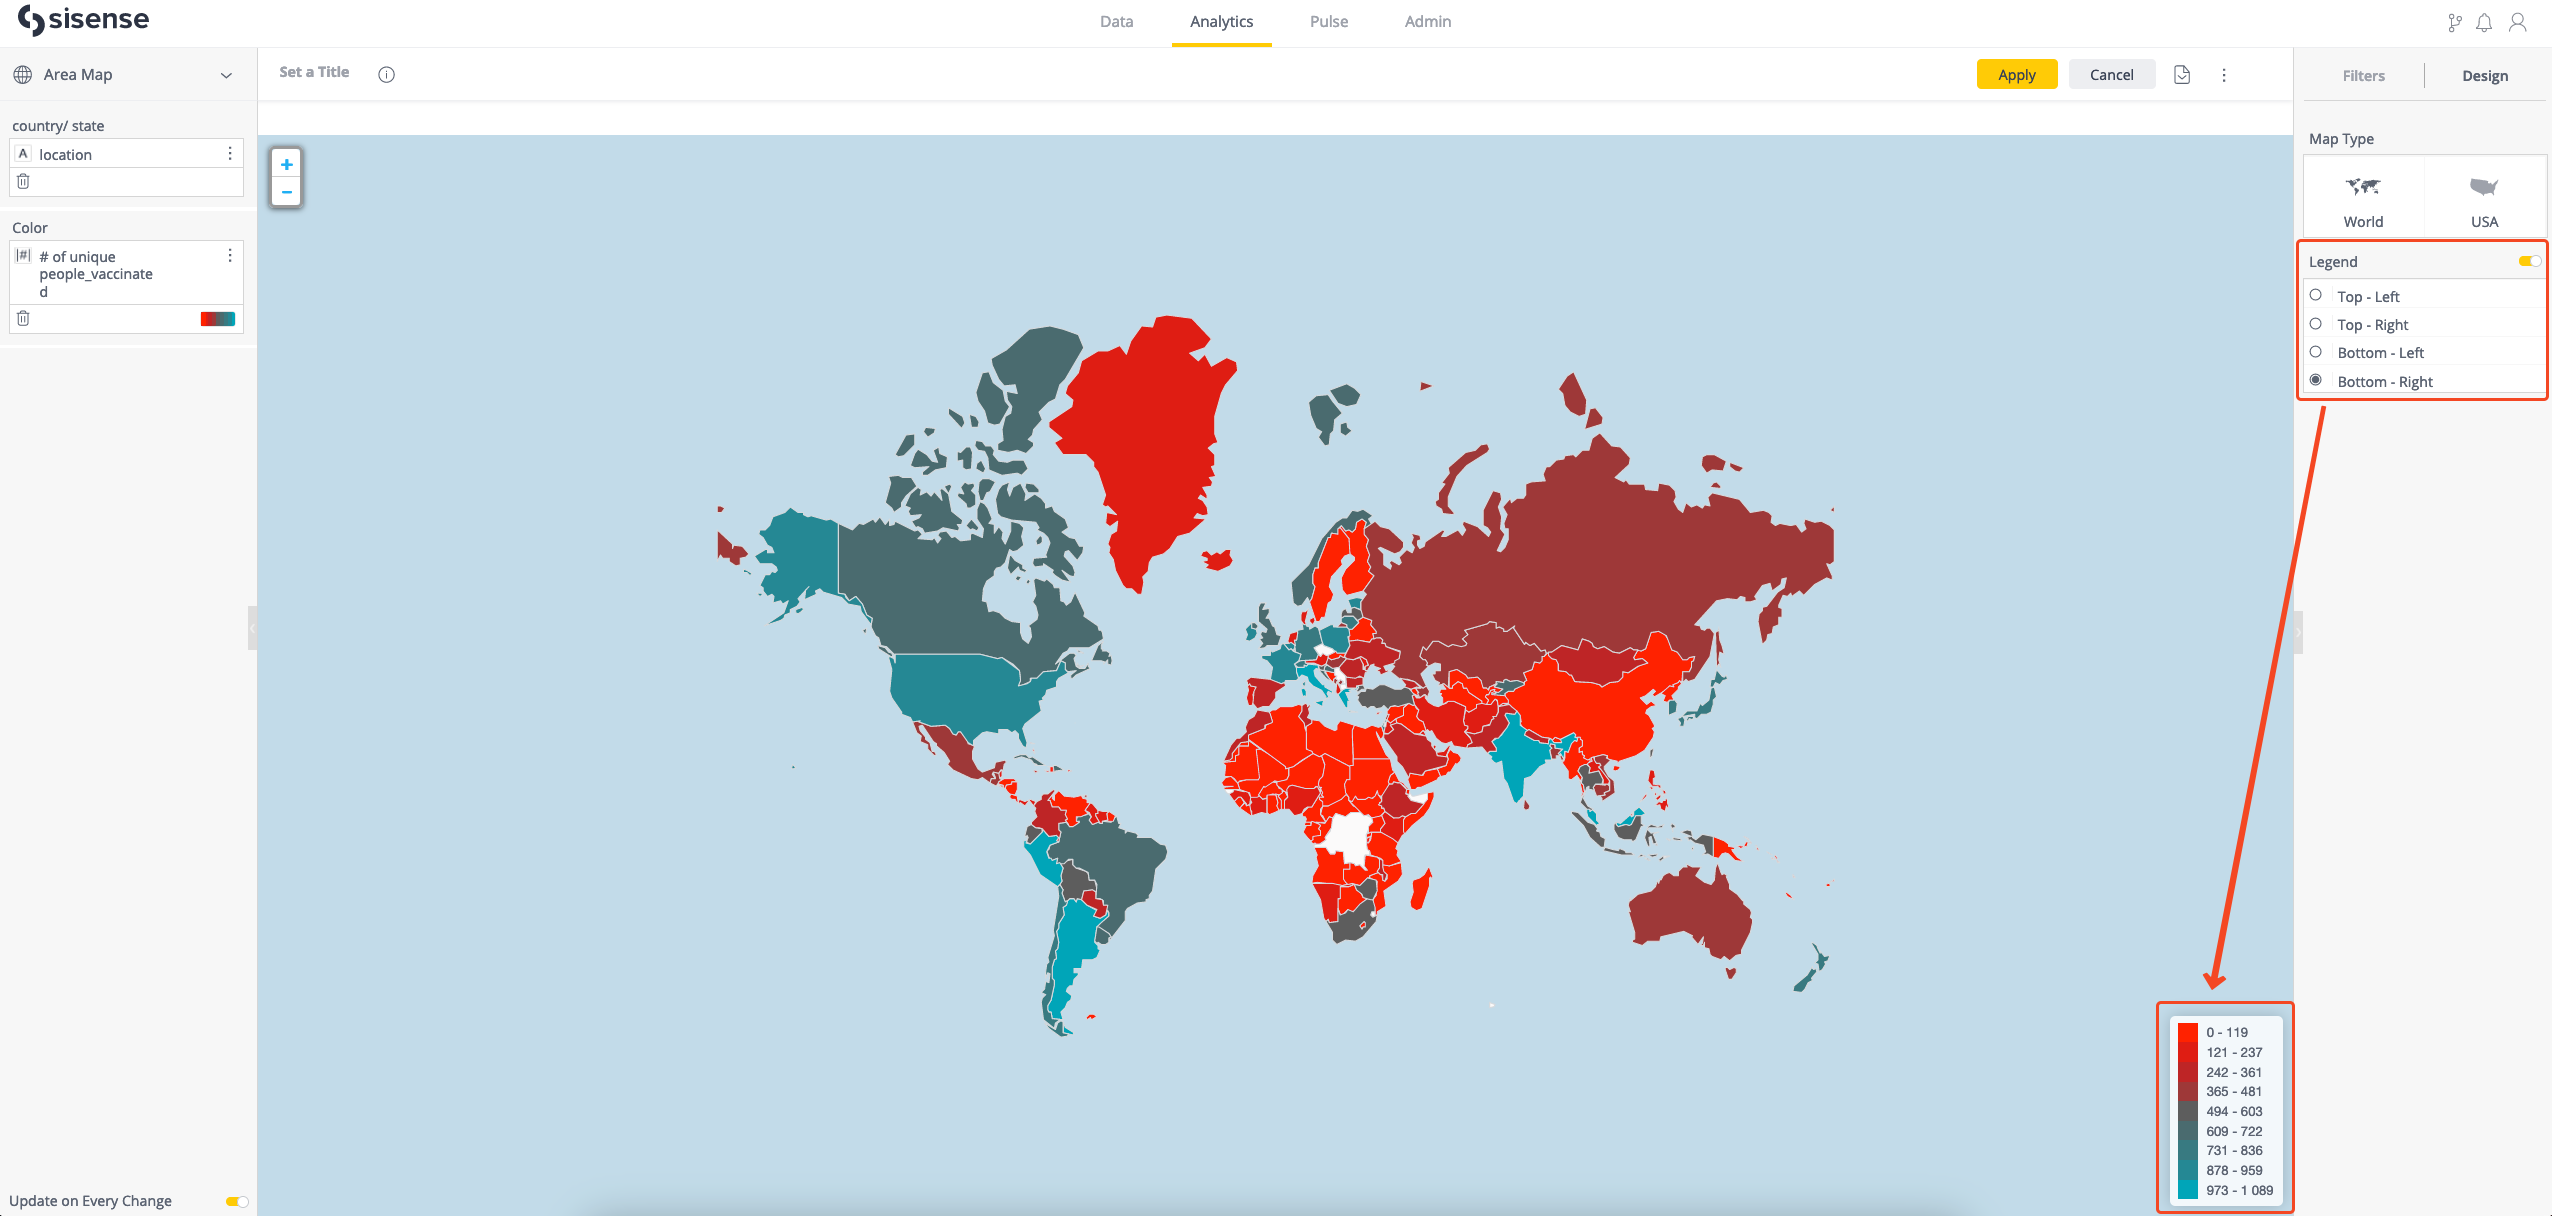
Area Map
The Area map now has the legend that enables easier analytics consumption by mapping colors on the map with the corresponding values of the measure. See Area Map for more information.
Audit Logs
In addition to the events which are already recorded in the audit logs, the following events are now also recorded:
-
User authentication and authorization: Successful Login Attempt, Failed Login Attempt, Password Reset
-
Collaboration and sharing: Share dashboard, Modify a dashboard share, Share model, Modify a model share
-
System configuration changes: Any feature toggle On\Off
-
Administrative actions: License modification
Events which take place for a tenant are now logged within the scope of that tenant. The events are tracked for the tenant that they exist in, and they are audited in the file in the relevant tenant.
For more information, see Audit Logs.
BloX
The BloX widget type is now fully compatible with self-contained multitenancy, meaning that all of the BloX assets, like templates and actions, are isolated within the tenant in which they were created. All custom actions and templates that were created before the upgrade will be migrated to be under the ownership of the system tenant.
Customizing the Dashboard Loading Screen Animation
Look and Feel themes have been extended with the ability to use your own dashboard loading screen. In order to add new loading animation it needs to be uploaded in SVG format to the system.
To use a custom animation, go to the Look and Feel configuration area (Admin tab > App Configuration > Look and Feel), open the Look and Feel theme, and scroll down to Dashboard Design Settings. The Dashboard Loading Screen section is where you will upload an SVG file and name the new dashboard loading screen animation.

Once a new loading animation is created it can be selected in any other theme on this instance.

See Customizing the Sisense User Interface for more detailed information.
Dashboard PDFs Embedded in Emails
When dashboard images are embedded in emails as PDFs, the configuration toggle Scale Dashboards Embedded in Email Based on PDF Settings supports the option to have the dashboard images sized according to the dashboard’s PDF settings. To use this option, enable the configuration toggle and set the PDF settings (Paper Size and Orientation) as desired. When the toggle is enabled, but no PDF settings have been defined, the embedded PDFs will use the default A4 portrait setting.
To enable: Admin tab > System Management (under Server & Hardware) > Configuration (top-right corner) > Exporting section > toggle Scale Dashboards Embedded in Email Based on PDF Settings.
See Sending Dashboards as Email Reports for related information.
Data Modeling and Perspectives
The following improvements have been made for data modeling and Perspectives:
-
Number of relationships on table - The number of relationships is now displayed on the table level. This helps indicate the importance of a table (for example, Facts, Data Security table, Shared Dimension).
-
Deleting models with dependencies - Now, when deleting a model with dependencies (such as dashboards), when the user selects a new model to move those dependencies to, all of the child Perspective dependencies are moved as well.
-
Relationships and Data Security notification - When creating or editing a new Perspective, there is now a notification that explains the required information for applying Relationships and Data Security.
-
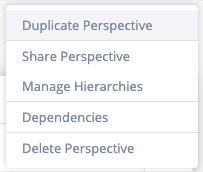
Duplicate Perspectives - Now you can duplicate an existing perspective with a similar experience as on models.
-
Perspective Dependencies - The new Move Dependencies functionality is now available on the Perspective level.
-
Perspectives Manage Hierarchies (Drill Hierarchies) - Hierarchy management is now supported on the Perspective level. Currently, new hierarchies can be created, but existing ones cannot be inherited from the Root model.
-
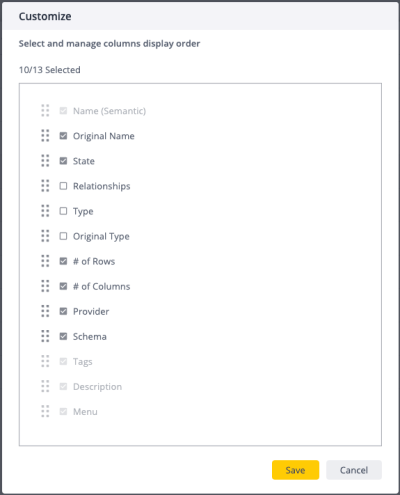
Customizing columns - In Model/Perspective List mode, you can now customize the visible columns, and the position of each column, in the table using the “Customize Views” button.
Exploration Paths for Widgets
Restarting the Intelligence Service (used by the Exploration Paths for Widgets functionality) no longer forces the suggestions to be updated, which improves pod uptime performance.
These new API endpoints can be used when it is necessary to update the suggestions manually:
-
GET /data-exploration/status
-
POST /data-exploration/refresh
-
POST /data-exploration/refresh/datasource
A nightly cron job will continue to update the suggestions used by Exploration Paths every 24 hours.
Other improvements:
-
The performance of generating suggestions for additional analysis was improved.
-
Now, only suggestions relevant to the specific widget are now available for the user.
For more information about how the Exploration Paths functionality generates suggestions, see Exploration Paths for Widgets.
Export to CSV
Number Formatting in CSV Downloads
Now CSV downloads can preserve the number formatting, such as decimal places and the thousands separator, as defined in the Format Number configuration.
To enable: Admin tab > System Management (under Server & Hardware) > Configuration (top-right corner) > Exporting section > toggle Formatted CSV Exporting.
Settings that will be preserved when exporting to CSV:
-
Decimal Places - When the number of digits is explicitly specified
-
Thousands separator – Separated or not
Settings that will not be preserved when exporting:
-
Decimal Places - When set to ‘Automatic’
-
Abbreviations
-
Currency
-
Percent
Localization
The number format settings define only the number of digits after the decimal point, and whether the thousands separator is used or not.
The use of specific separators (comma, dot, space) is determined based on the browser locale on the user's machine.
Field Suggestions for Widgets
This new suggestions API endpoint can be used to refresh the suggestions used by the field suggestions for widgets functionality:
See Using Field Suggestions for Widgets for more information.
Functions
STDEV is now supported on the analytical engine for ElastiCubes.
Git
Performance Optimization
Optimized the performance of selecting and assigning new assets to the project, which previously might have caused page freezes.
Asset Names Included with OID for Git Tracking
JSON files that represent decomposed assets, (such as data models and dashboards) now include the actual name of the asset - concatenated with the unique OID, which is essential for Git tracking.
![]()
This is a significant improvement toward traceability and maintainability of the Git-tracked assets. It makes it possible to understand exactly which assets changed, and improves navigation in the changes files on the remote repository.
![]()
Renaming an asset in the application will lead to the renaming of the actual file folder, and recursively, all of its child folders. This operation is done with the use of the git mv command, (see Git - git-mv Documentation). As part of this change, git revert is no longer "soft". This means that revert will automatically create a new commit, when previously it was required to add a message and make a commit manually.
![]()
When there is a file path conflict due to the renaming of assets - the conflict will be resolved automatically by applying the path corresponding to the new asset name.
In existing projects the new naming convention will be applied with the [ Refresh ] operation and the new file paths will be reflected as uncommitted changes that should be committed. The new changes support backwards compatibility to prevent any kind of breaking changes.
Note:
Along with the changed naming convention dashboards/{oid}/dashboard.json > dashboards/{oid} ${asset_name}/dashboard.json, the validation of the number of chars in the names of pulled assets has been changed. In other words, previously (<L2023.11) the system expected the asset name to be 24 chars, which is equal to the asset oid. Since L2023.11, the asset name will be longer.
In order to maintain consistency and avoid breaking validation rules, make sure that all of your environments (dev, stage, prod, etc.) are updated to L2023.11 before making any changes in the Git projects.
Highcharts
The Highcharts library was updated to version 10.
WARNING:
This upgrade includes significant changes to the Highcharts API which can potentially affect any custom Highcharts configurations made on your side (for example, enabling dataLabels).
To avoid breaking changes, it is recommended that you migrate your customizations to Highcharts version 10 prior to upgrading your Sisense version.
Kubernetes
Kubernetes 1.28 is now supported starting with this version of Sisense.
Simply Ask (NLQ)
Simply Ask now inherits the dashboard filters (respective to the dashboard Simply Ask is invoked from), such that the question being asked in Simply Ask implicitly applies the dashboard filters in the background. This ensures that the numbers that appear in Simply Ask match those in the underlying dashboard.
Note:
Until now, dashboard filters were not applied to the Simply Ask modal. Now they are applied by default which may result in breaking changes. If you want to ignore the dashboard filters (i.e., to revert to the state before this improvement), you can do that manually via the dashboard menu option.
See Querying Your Data with Simply Ask (NLQ) for more information.
SSO
The OpenID Connect (OIDC) protocol for SSO integration between Sisense and an Identity Provider now supports organization tenants. See SSO Using OpenID Connect for more information.
Widget to High-quality Image Downloading
The option to download images of widgets in the PNG format has been improved with server-side export functionality. This option enables widgets to be exported as full resolution images, each according to its original size. For Pivot and Table widgets the image will include all of the columns that were rendered in the dashboard, not just the columns that were visible on the screen. Keep in mind that downloading high-quality widget images takes longer than the default image download.
To enable: Admin tab > System Management (under Server & Hardware) > Configuration (top-right corner) > Exporting section > toggle Full-Size Widget to Image Download.
See Downloading a Widget as an Image for more information.
Widget Value Formatting
The widget Format Number dialog now includes the “Abbreviate all values” option. This should be useful for financial and other fields, where consistent formatting is required across all of the data.

When “Abbreviate all values” is selected all of the values are abbreviated according to the selected measure(s):
-
When one abbreviation is selected - all of the dimension’s values in the widget are formatted based on that measure.
For example, 445,000 will be formatted as 0.45M, and 1,200,000 will be formatted as 1.2M, when 1M with “Abbreviate all values” is selected. -
If several abbreviations are selected - the values are rounded to the next highest selected abbreviation for formatting. For example, if “1K” and “1B” are selected:
-
400 → 0.4K
-
445 514.3 → 445.51K
-
952 823.07 → 952.82K
-
1 200 000 → 1200K
-
1300000999 → 1.3B
-
Note:
This new additional capability does not include any kind of migration or breaking changes - your data will remain displayed as per the latest formatting configuration.
See Formatting and Localization of Widget Data for more information.
System Configuration
The toggle Allow Pivot range background feature has been removed from the system configuration because this functionality is now always enabled as part of the system.
What's Fixed
Add-ons
-
The premium add-on Single Sign-On (SSO) Router is now working as expected in environments with configured organization tenants.
-
Metadata aliasing (see Translating Metadata to a Different Language) is now applied to the quick preview in the data browser.
-
The premium add-on Report Manager now returns all of the matching users in Search, including the one from the Active Directory group.
-
The Dynamic ElastiCubes add-on now has the ability to configure whether filters should be reset through the resetFiltersMembers (BOOLEAN) property:
-
If set to false: The dashboard filters will not be switched to IncludeAll (multi selection) or to first member (single selection). Selected members will persist.
-
If set to true (default): The dashboard filters will be switched to IncludeAll (multi selection) or to first member (single selection).
-
-
When jumping with JTD (Jump To Destination) from subtotals, the filters are applied as expected.
-
After jumping with a date filter using JTD, drilling is now working as expected.
-
The border between widgets configured with the Tabber add-on is now displayed as expected.
-
Admins now can share all dashboards when the Dynamic ElastiCube add-on is enabled, using their admin access.
-
Formula based filters pass values as expected and are not causing errors when using the Dynamic ElastiCube add-on.
-
The Metadata Aliasing plugin no longer causes errors in background filters.
Application
-
Navigation between the main application pages, such as Data and Analytics, now works as expected.
BloX
To ensure that BloX images are accessible, even after upgrading Sisense:
-
For new instances: To use custom images for BloX widgets, create a folder inside the plugins folder (for example, BloX-Resources) and use it to store your images.
-
Paths to images in your BloX widgets configurations should point to the image file in the created folder: /plugins/BloX-Resources/myImage.png
-
-
For upgraded environments: the BloX/blox-images folder is kept inside the plugins folder. You can continue using this location for your custom images or create a new folder in the plugins folder for your images.
Builds
-
Builds no longer fail due to controlled memory safety termination.
Dashboards
-
Exporting dashboards to
.dashfiles does not fail when it has a hierarchy connected to a non-existing data model.
Data Tab
-
The data tab uses web sockets, whose quantity are limited per browser process. Previously, when many tabs were opened, and the limit was exceeded, when switching back to the original data tab, the web sockets would be dead. Starting in version L2023.11, whenever the data tab is selected, the web sockets are refreshed and the models are refetched.
Embedding
-
Sisense.v1.js now uses its own scope for
windowandglobalThis. This should prevent pollution of the global scope and force usage of our own polyfills in thesisense.jsscope.
This also enables Sisense.js compatibility with Angular based parent applications. -
When Sisense.js is based on a proxy server it now works as expected.
-
Embed SDK is now loading as expected and not breaking embedding solutions due to the "
Uncaught TypeError: t.IFrameRpc is not a constructor" error.
Explanations
-
When clicking on a chart to receive Explanations, in some cases, the dataset analyzed did not contain one of the dates for comparison. There is now a more informative error message, and you can manually select other dimensions and run Explanations again.
Git
-
Fixed "Error generating asset: Cannot read properties of undefined (reading 'tables')" when importing data models during the Pull operation.
-
The
_dataSourcePermissionproperty has been removed from the list of tracked Git properties, which is irrelevant in terms of the development to product flow, and it was creating unintended uncommitted changes. -
The creation of new hierarchies and changes to hierarchies are now tracked in the Git projects.
-
The creation of new perspectives (see Perspectives) and changes to existing perspectives are now tracked in the Git projects.
Infusion Apps
-
Customers are now able to log into Infusion Apps using a VPN. Previously, when using a custom network configuration, and user access was only available via VPN, access was only allowed for some IP addresses. When users attempted to log into Infusion Apps, the system returned a 500 error.
Look and Feel
-
Widget title alignment is now applied as expected from the Look and Feel settings (Admin tab > App Configuration > Look and Feel > Widget Header Style), when the Widget Design Styling feature is enabled (Admin tab > App Configuration > Feature Management > Widget Design Styling).
Notebooks
-
Python and R code in the Notebooks tab now works as expected if you have a customized Kubernetes namespace for your Sisense application.
Query Editors
The URLs for invoking the SQL and JAQL editors in the browser are now formed as expected using “?” instead of “#”:
-
SQL editor - For example:
http://<url>/app/sqleditor?datasource=Sample ECommerce -
JAQL editor - For example:
http://<url>/app/jaqleditor?jaql={encoded jaql}
Also, additional query parameters can be added using “&”. For example, http://<url>/app/sqleditor?datasource=Sample ECommerce&query=select%205
Search
-
All of the dashboards are now returned for the users via the Search operation. See Locating Dashboards for more information.
Simply Ask (NLQ)
The Simply Ask Dashboard menu is now hidden from Viewers.
Widgets
-
Scattermap charts based on both the X-axis and Y-axis now load and display data as expected.
-
The Title checkbox is now present in the design panel of the Box & Whisker Plot widget during widget creation.
-
The Clear selection button (see Making Selections in a Widget) now resets Scatter Map filters as expected in the same consistent manner as the rest of the widgets.
-
The background color of the gauge-based Indicator widgets is now displayed as expected according to its configuration.
-
The refresh rate for live models that is set up on the widget level is now included during dashboard export/import.
-
BloX widgets are now displayed consistently in the PDF preview, dashboard, and the actual exported PDF file. If the title is hidden, this does not cause an empty space in the exported asset.
Limitations
Pivot “Results Per Page” Dropdown Disappears
The Results Per Page dropdown for Pivot tables disappears in the following situation:
-
Pivot returns between 11 and 74 rows, and this is less than the number of available rows.
-
The Results Per Page dropdown is used to change the results per page to 75 rows.
When this happens the Results Per Page dropdown disappears. The only way to recover it is to refresh the page.
Video
Watch this video for an overview of selected features from this release:
L2023.11 Service Update 1
The content below describes the bug fixes included in the March 2024, L2023.11 Service Update 1 release.
What’s Fixed
Add-ons
Accordion
-
Filters with an ‘OR’ relationship are now passed correctly to the Accordion sub-dashboard.
Jump To Dashboard (JTD)
-
Several issues with JTD passing filters are now fixed, including passing background filters, cascading filters, filters from query parameters, as well as handling filters when jumping from the Date column grand totals or column header in a Pivot widget.
-
Pivot styling is now applied as expected when opening the widget editor separately from the dashboard with JTD configured.
-
The issue with dashboards created by other users not being displayed to administrators due to JTD configuration is now fixed.
Metadata Aliasing
-
Widgets with shared formulas and metadata aliasing applied are now created and translated as expected.
Analytics
-
Queries on dashboards and widgets are now executed as expected and do not cause errors when data security is defined on a hidden table.
Build To Destination (B2D)
-
Scheduled builds in B2D models with Custom Code tables now work as expected.
Custom Code
-
Using additional parameters in Custom Code now works as expected.
Dashboard Co-Authoring
-
It is now possible to create and use shared formulas, as expected, both from Private and Shared mode.
Data Modeling / Connectors
-
The custom import query is now parsed and executed as expected.
-
Text type data is not converted to JSON, and is imported as expected in Salesforce-based data models.
Data Modeling and Perspectives
-
Sharing perspectives now works as expected when the data model's table scheme is updated.
Drill Hierarchies
-
Drill Hierarchies are now sorted alphabetically in the data model as expected.
Embedding
When embedding Sisense, administrators can now filter the available embedded domains in the server response based on the ‘Referer’ or ‘Origin’ headers in the client app requests. In order to limit the domains listed in the server response to the current domain only, contact customer support to enable the security.hideListOfAllowedEmbeddedDomains toggle in Base Configuration > Security.
Note:
If the client app does not send ‘Referer’ or ‘Origin’ headers, enabling this option will cause requests to fail.
Exploration Paths
-
The AI algorithm for Exploration Paths now takes into consideration the existing filters’ sentiments from the current widget/dashboard context.
Exporting
-
When changing the PDF report settings, the preview is now updated to immediately reflect changes.
Filters
-
Filters with rankings based on formulas with multi-pass aggregation now return results and work as expected.
-
Advanced filters are now applied as expected in combination with cascading filters.
-
It is no longer possible to select a value on a disabled single-select filter.
-
Viewers are no longer able to change the Ranked by field in the Top/Bottom filters.
Formulas
-
The PASTMONTH formula now accepts and processes second parameters.
Infra
-
Copying to the server now works as expected when the instance-receiver uses the Session Inactivity mode.
-
Fixed high memory consumption during system backup creation.
Multitenancy
-
The dashboards now load as expected when the datasource name begins with the tenant name.
Pulse
-
Pulse alerts can now be shared with users without a defined password.
SQL Editor
-
The SQL editor used when defining custom tables or custom columns is now not refreshed and data is not lost when navigating between browser tabs.
Usage Analytics
-
Usage Analytics now contains data for the groups imported from the Active Directory.
Web Access Token
-
custom_data endpoints are now accessible to be used in the Web Access Token flow.
Widgets
Area Map
-
The list of countries for the Area Map has been updated to include countries that were previously missing.
BloX
-
The BloX widget height is now aligned with the rest of the widgets in the same row.
-
BloX now handles NULL and N/A values consistently with the rest of the widgets.
Break By
-
Break by panel behavior can now be configured to serve different visualization purposes. By default, the break by criteria is handled as rows. That is, for each data point, the value is categorized by the selected criteria. If break by columns is selected, the value of the selected criteria is categorized across the data points.