Narrative
Last updated: June 10, 2026
| Tier | Deployment | Availability |
|
|
|
Classic Mode Only |
Narrative automatically generates clear, insightful text summaries directly within your widgets, translating complex visuals into natural-language insights that help users understand and act on key takeaways instantly. It enhances data literacy by guiding users and eliminating the need for manual analysis. Narrative is currently available for managed cloud customers, with a paid narrative license. This procedure assumes that you have purchased and activated narrative for your account. Contact your Customer Service Manager for more information.
Sisense supports widget narration for the following widget types: Pie chart, Column chart, Bar chart, Line chart, Area chart, Treemap, Area map, Scatter map, Scatter plot, Sunburst, and Polar chart.
Enabling Narrative
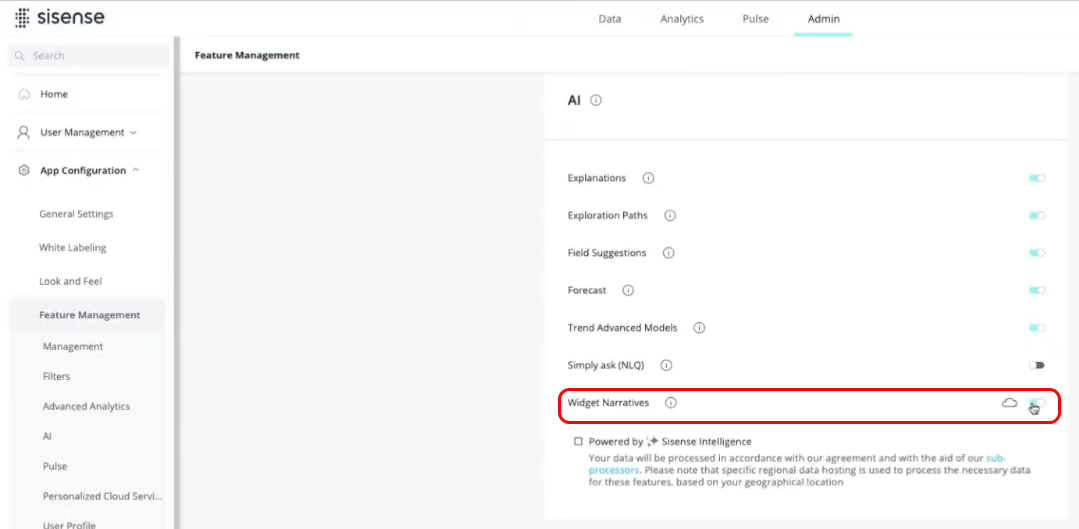
A Sisense Administrator must activate narrative. To enable it:
-
Open the Admin tab, search for and select Feature Management, which is located under App Configuration, and in the AI section, toggle on Widget Narratives.
-
Select the Powered by Sisense Intelligence checkbox to use the new and improved version of narrative.
Once the administrator has enabled narrative, designers can enable narrative for supported widgets. Narrative is enabled on the widget level. This means that you can select which widgets will have narrative, and which will not.
Note:
If you are using Narrative or Managed LLM features, you must whitelist the public Sisense IP address 52.210.201.22/32 in your firewall or network security configurations.
Using Narrative
-
Open the Analytics tab.
-
Open a dashboard.
-
In a widget, click
 to open the widget in edit mode.
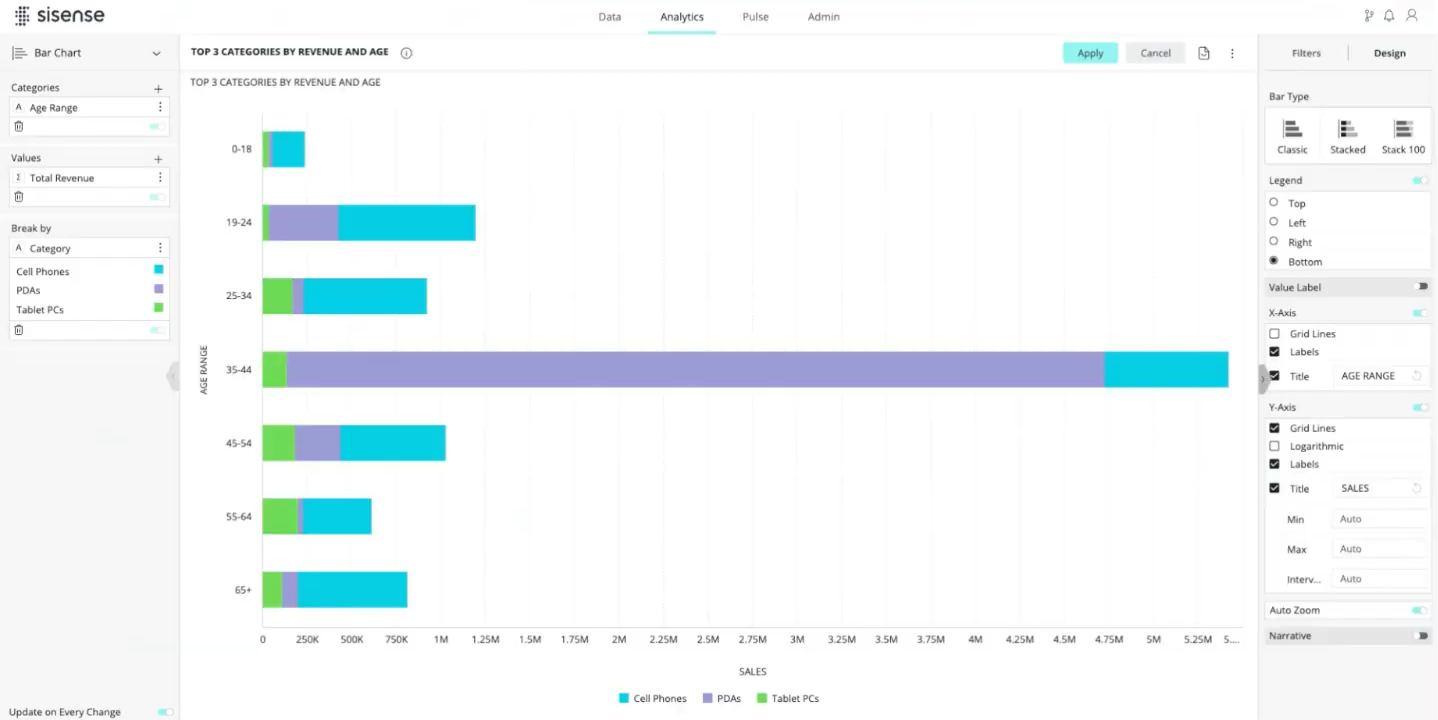
-
Toggle on Narrative for the widget.
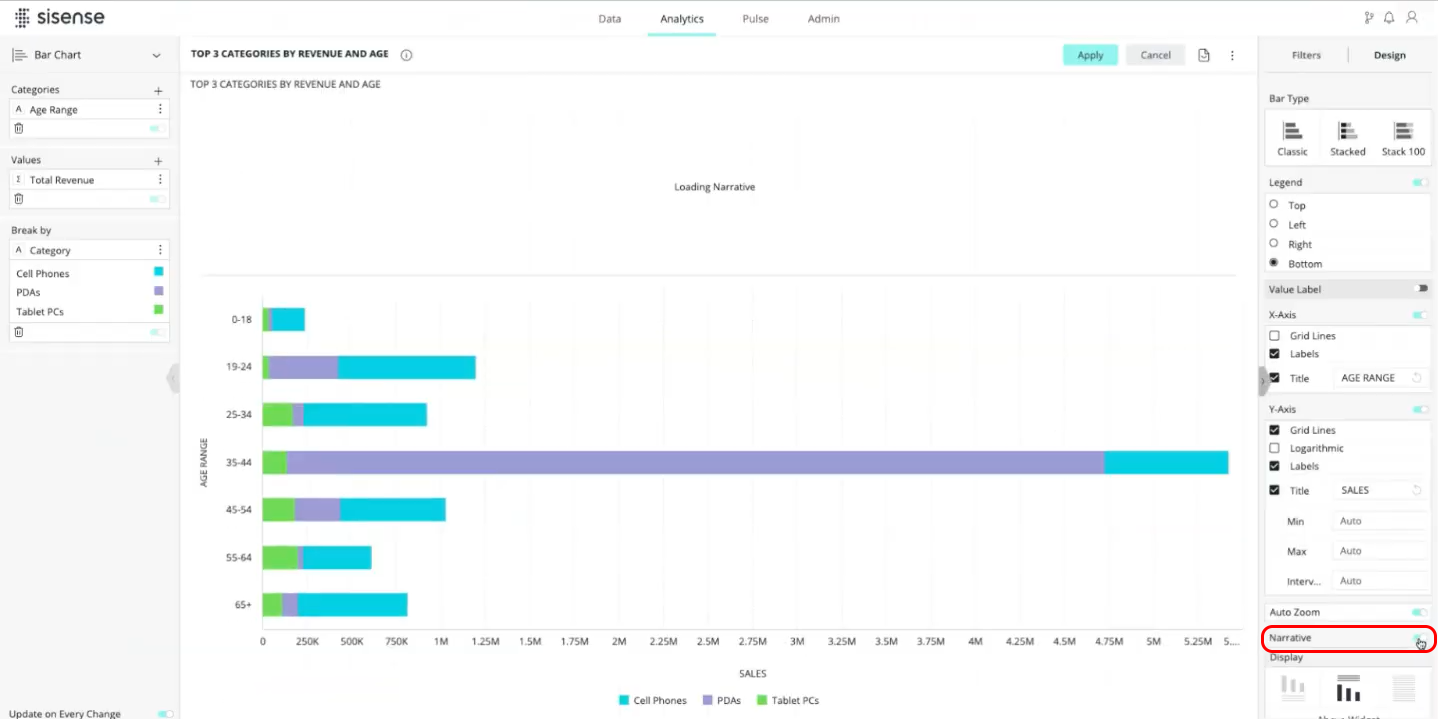
The narrative panel appears, summarizing the widget's key insights.
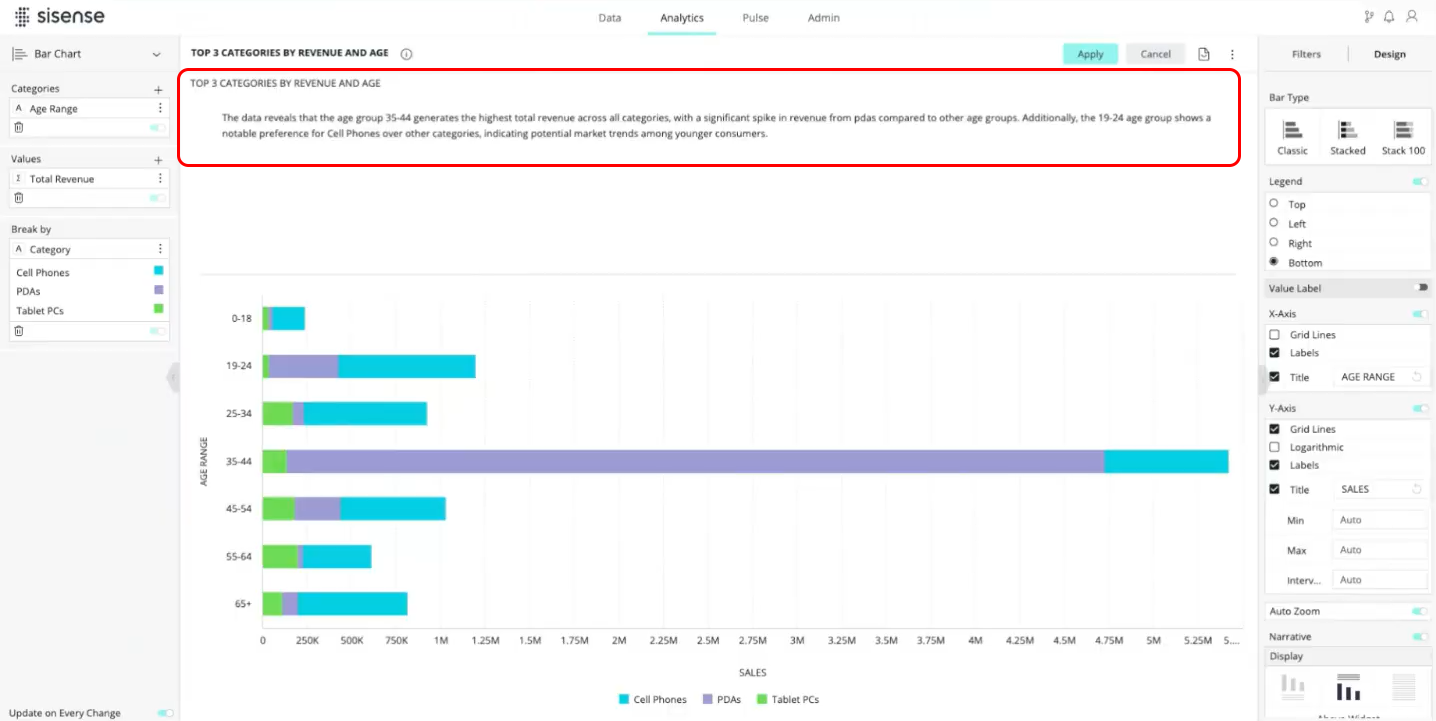
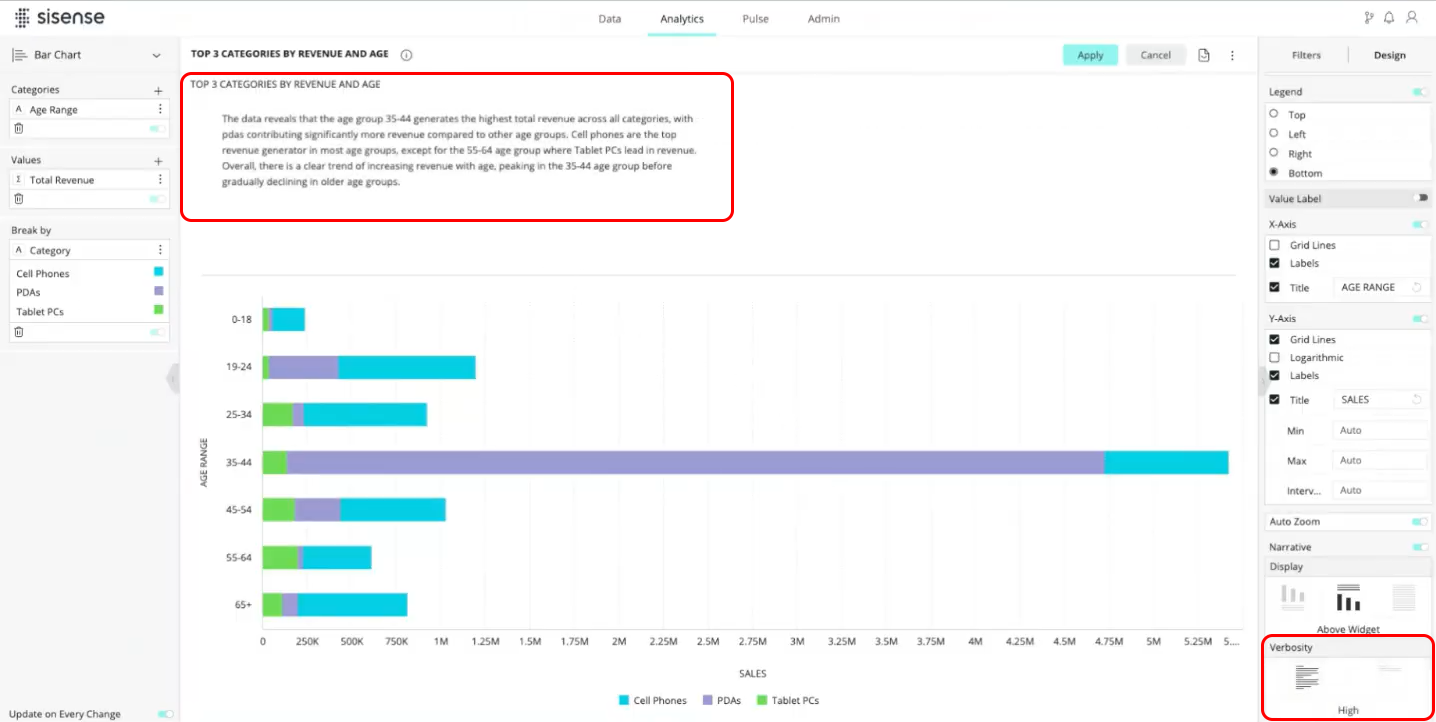
-
The language is clear and concise. However, if you would like more information, you can adjust the verbosity level (which is "Low" by default). To do this, in the Verbosity section, select High. A more detailed narrative is presented.
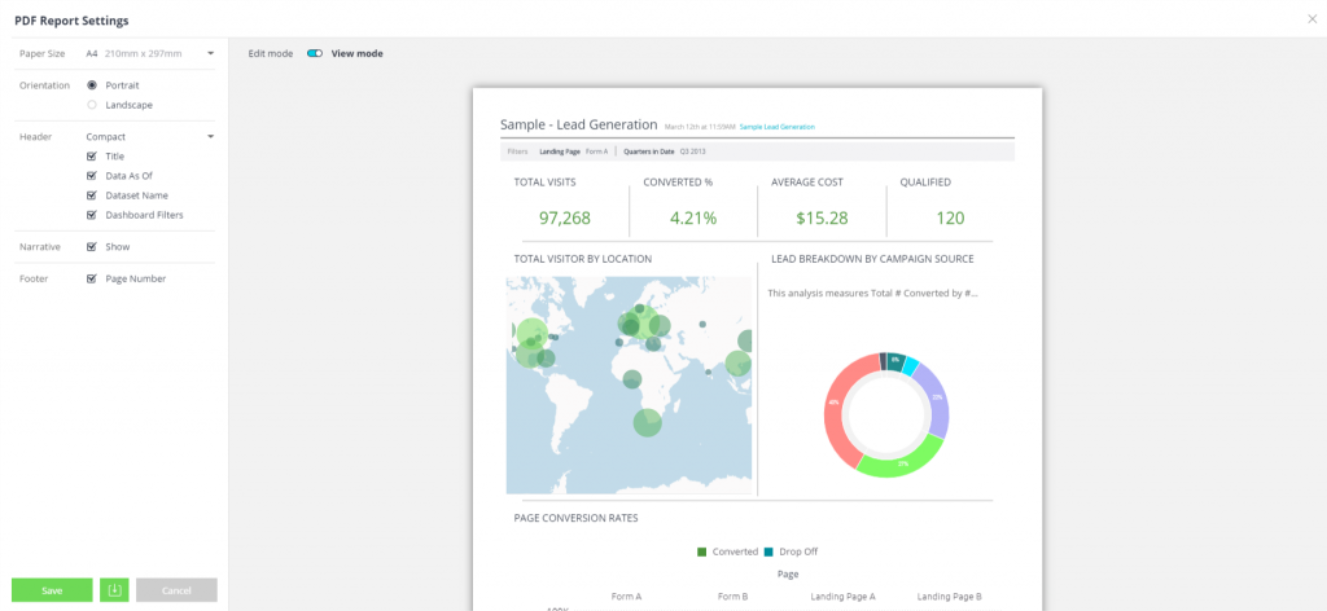
PDF Reports
If you export your dashboards to PDF reports, you can configure Sisense to include or exclude the narrated text in your report from the PDF Report Settings window.
Select the Narrative checkbox to display your narrated text in your PDF report.