Area Map
Last updated: June 11, 2026
| Tier | Deployment |
|
|
|
Area Maps allow you to visualize geographical data as polygons on a map.
Sisense uses a cloud service to position data points on the map using a geocoding service.
You can use your data to affect the color of the areas.
For a short video overview of area maps, see below:
Adding Data
Area Maps support fields that contain either countries or US states.
By default, a world map is used. If you add a field containing countries, they will be presented in the world map.
If you add a field containing US states, make sure to select USA from Map Type in the design panel on the right.
You should choose the appropriate Map Type depending on your the field being displayed. If the field is for states, then select the State Map Type.
Color
Select a numeric field here to color the areas on the map according to their value and color rule.
The value of the field is displayed in the tooltip of the area on the map. Hover over the area to see it.
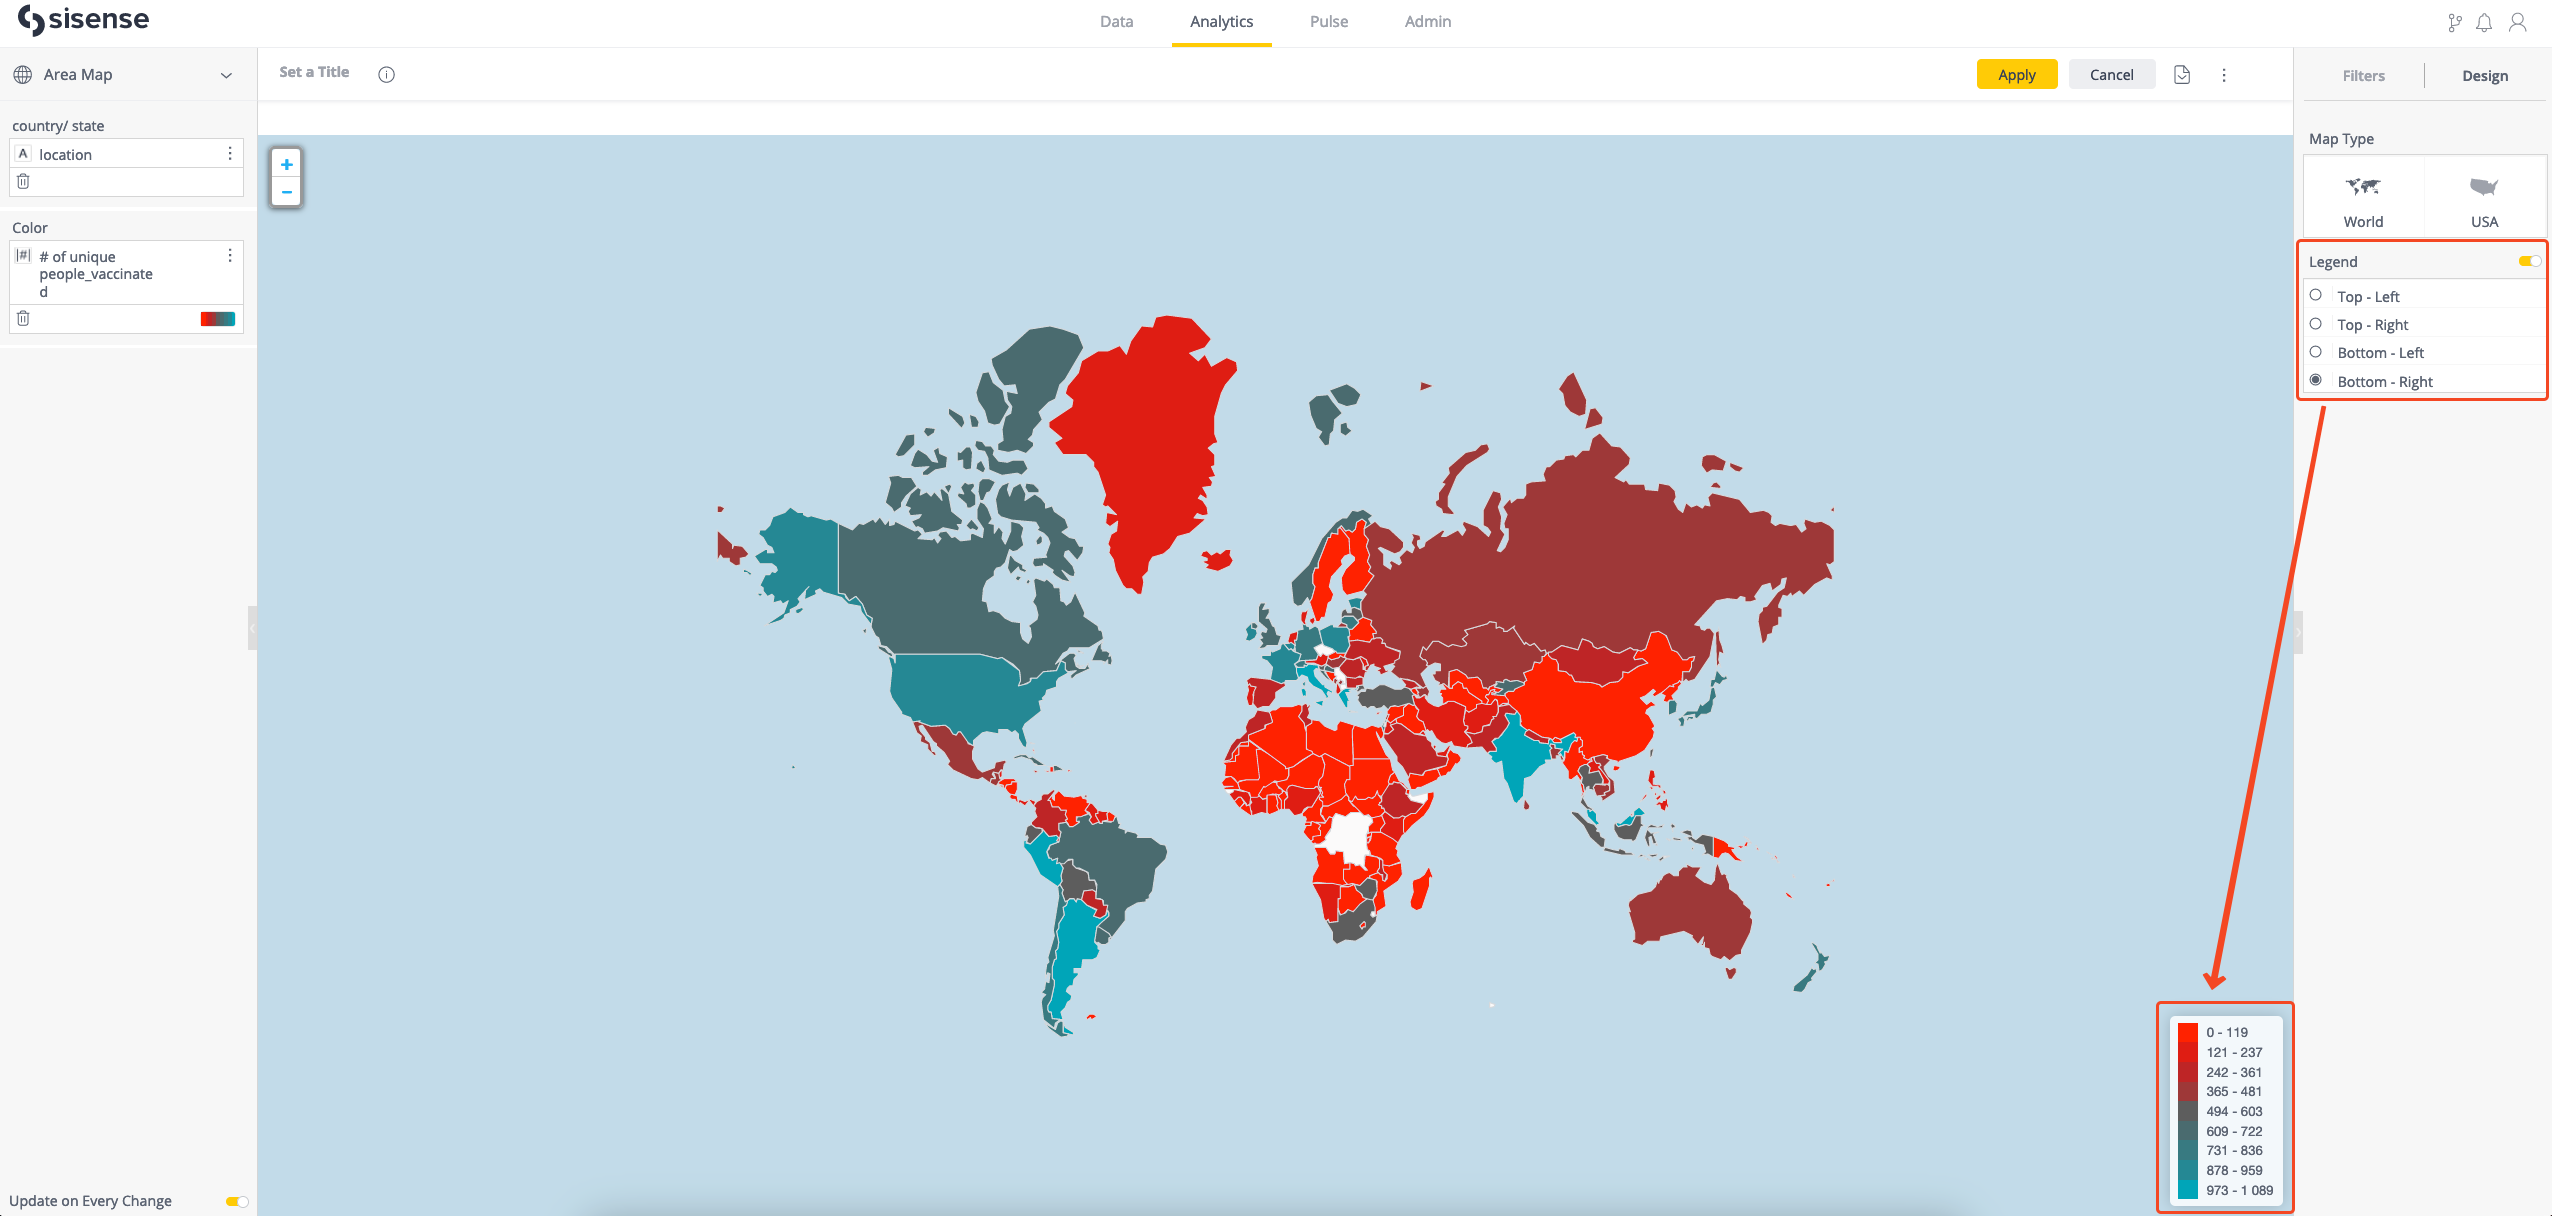
Designing the Area Map
Fine tune the appearance of the Area Map widget using the following tools:
-
Map Type: Choose between a World map or a USA state map.
-
Legend: Choose whether to display the legend, and in which corner of the map it should appear.