Introduction to Dashboards
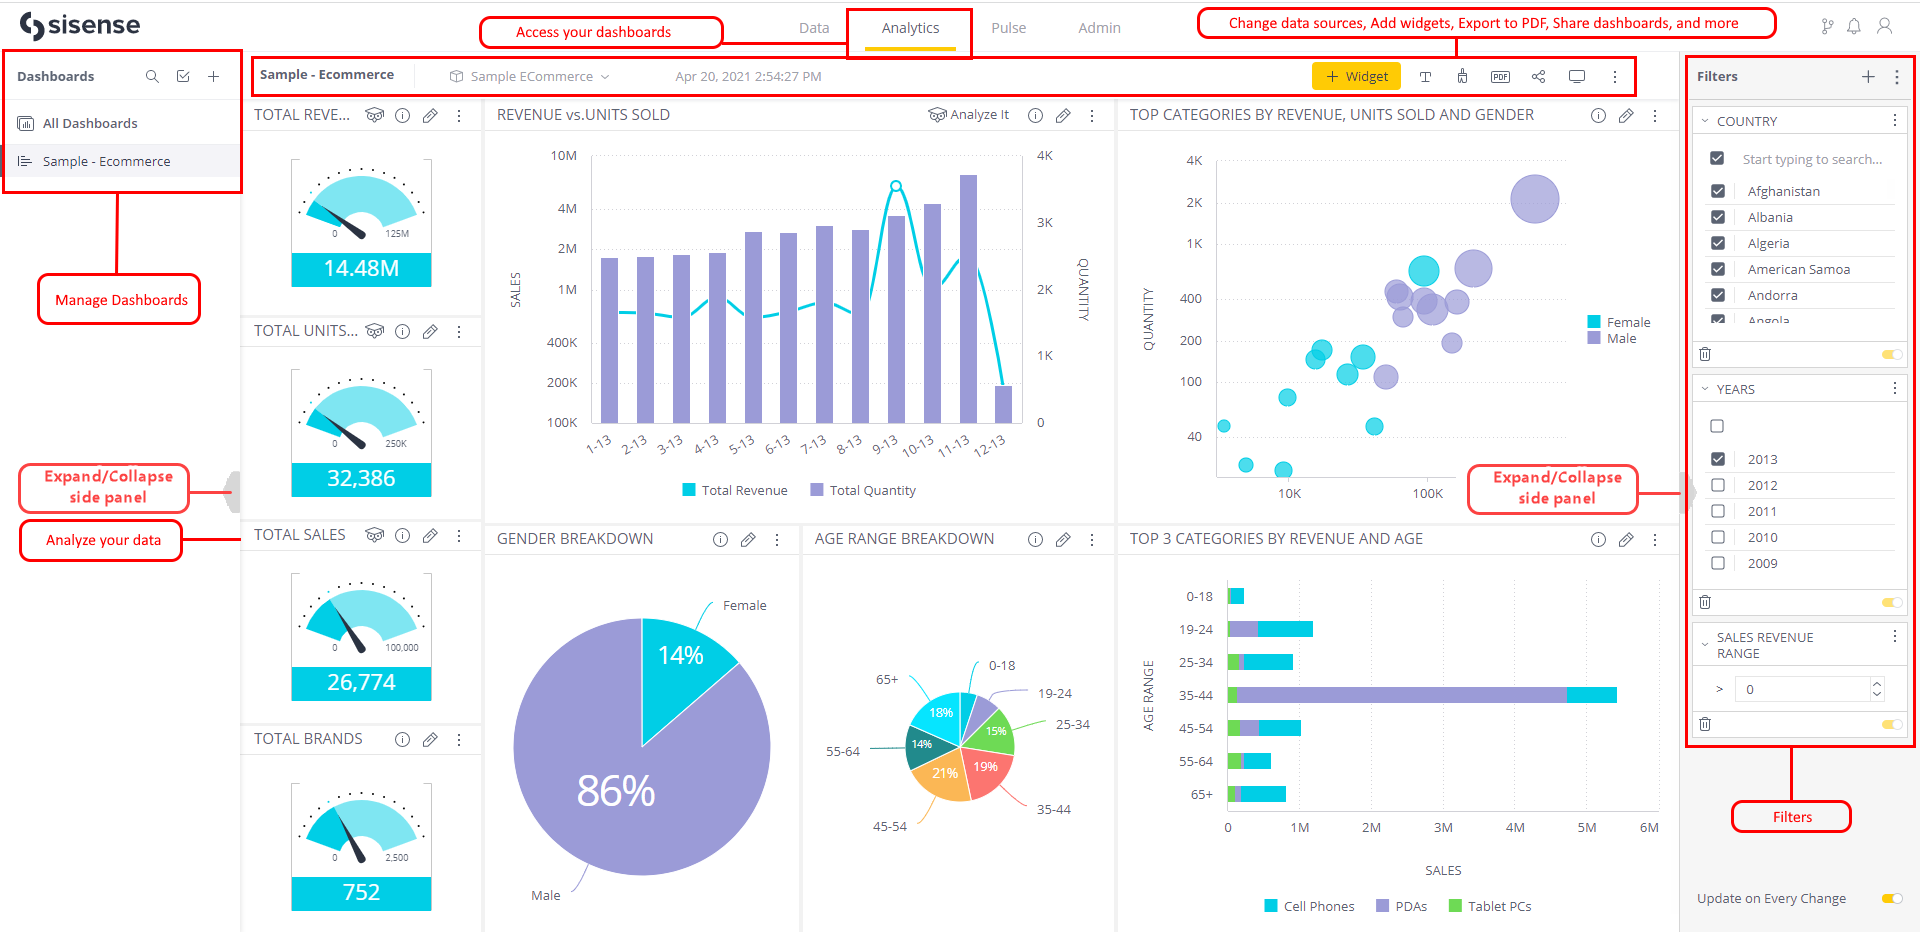
After importing data into Sisense, the next step is to create dashboards that Viewers can interact with.
This section will show you how to get started working with your dashboards.
Creating Dashboards
Designers and Dashboard Designers can create dashboards from the Analytics page where all your existing dashboards are displayed.

When you create a dashboard, your dashboard is initially empty. The next step is to add widgets, or visualizations, to your dashboard to make it meaningful.
The topics below provide information about creating dashboards, adding widgets to it, and customizing the data displayed in the dashboard:
- Creating Dashboards
- Adding Widgets to a Dashboard
- Managing Widgets
- Filtering Dashboards and Widgets
- Creating and Editing a Widget Formula
- Date and Time Fields
- Customizing the Dashboard Layout
- Changing the Dashboard's Color Palette
- Changing a Dashboard's Data Source
Managing and Sharing Dashboards
As a Designer, you can manage dashboards that you have created, or that have been shared with you:
- Managing Dashboards Overview
- Organizing Dashboards
- Locating Dashboards
- Deleting Dashboards
- Sharing Dashboards
Interacting with Dashboards
Now that you've created your dashboards, it's time to start interacting with them:
