Drilling Down in a Widget
Last updated: June 11, 2026
| Tier | Deployment |
|
|
|
For information about enabling or disabling the drilling feature, see Adding Drill Hierarchies to Widgets. For information about configuring drill hierarchies, see Managing Drill Hierarchies.
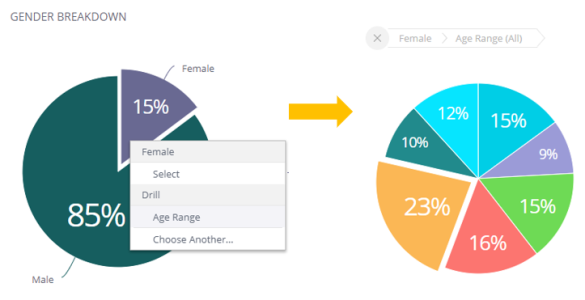
In the following example, the pie chart on the left shows a breakdown by gender. This is the original chart as created by the dashboard's Designer. On the right side, the chart shows a breakdown or drill down showing age groups of the 'female' segment from the original pie chart.
This topic describes how you can drill down into your data in most widgets to get an in-depth view of a selected value.
With Sisense you can drill down from any field to any field, unless disabled by the dashboard's Designer.
For a short video overview of drill hierarchies, see below:
Using Drill Hierarchies
To drill down into a chart:
-
Right-click on the item in the widget into which you want to drill down.
-
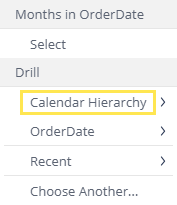
To manually select the drill hierarchy path, select Drill Into, and then in the In the Data Browser, select the field into which to drill down. If you have already drilled into this chart, then you will have shortcuts to previously selected fields, or select Choose Another Field to select a different field for the first time.
OR
Select a predefined drill hierarchy (if available). Predefined drill hierarchies are defined by the dashboard's owner.
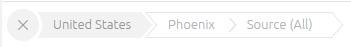
To drill up to a higher level, click on a breadcrumb. To drill all the way up, click on the X icon.
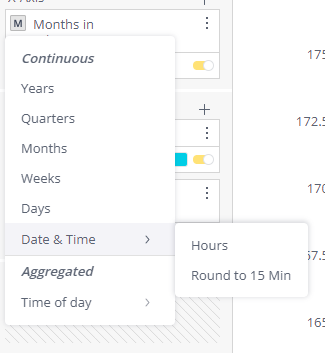
Drilling Down by Date
Dashboard Viewers have the option to drill down the widget according to the Date level:
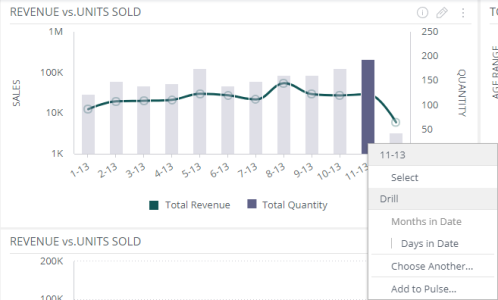
Viewers can drill down into the lowest date or time resolution available in the data.
For more information about filters, see Creating Dashboard Legacy Filters.