Creating Dashboards
There are two ways you can create dashboards: the first is through the Sisense Analytics page, and the second is through the Sisense REST API.
The difference between these two methods is that the Analytics page provides an interface where you populate the dashboard with widgets.
To create a dashboard through the REST API, you define the dashboard and then populate it with widgets that already exist through their widget IDs.
Creating a Dashboard
Each Dashboard is based on the data selected from one or more ElastiCubes or Live data sources. The instructions below assume that the required ElastiCube(s) and Live data model(s) have already been created. You can also use the sample ElastiCubes that are installed with Sisense if you have not yet created your own.
For a short video overview of creating dashboards, see below:
To create a dashboard:
-
In the Analytics page, click + above the Dashboards list.
OR
Right-click on the folder menu and select New Dashboard.

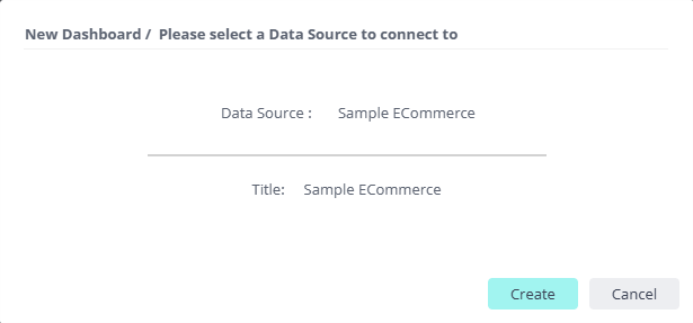
The following window appears:

-
Click the name of the Data Set displayed to select the ElastiCube or Live data model you want to work with. ElastiCubes have the

icon next to their name. -
Click the name of the Title, and enter a name for the dashboard. This name will appear at the top of the dashboard, and in the Dashboards list.
Note:
The dashboard title is limited to 255 characters and cannot contain "/".
-
Click Create.
You are then automatically guided through the process of creating your first widget in the Widget Wizard, as described in Adding Widgets to a Dashboard.
Creating Dashboards through the REST API
The Sisense REST API enables you to programmatically create dashboards by defining the basic properties of a dashboard such as Title, datasource, and owner. After defining the properties of the dashboard, you define its visualizations by including the widget IDs of pre-existing widgets.
To create a dashboard through the REST API:
-
In Sisense, click Admin at the top, and then search for and select REST API, or select it from the left navigation pane.
-
Select version 1.0 on the top-right of the screen.
-
Select Dashboards then POST /dashboards.
-
In the body of your call, define the values of the following keys:
Key Value Title String that defines the name of the dashboard as displayed in Sisense. desc String that represents a short description of the dashboard. datasource Object that defines the data source where the dashboard pulls its data.
This object contains the following elements:
title: The name of the data source.id: The address and name of the data source where the dashboard queries its data from.
address: The address of the dashboard.
database: The name of the data source where the data is pulled from by the dashboard.
fullname: The name of the data source.
filters This object defines the dashboard filters that the user add goes to the "filters" object in the .dash file.
This object contains the following elements:
datatype: The type of data affected by the filter, for example, text.
title: The name of the filter displayed in the Filters pane.
layout Object that defines what widgets are displayed in the dashboard and their layout.
This object contains the following elements:
type: String that defines how the layout of the dashboard. This value should be "columnar".
columns: Array objects that defines the width of each column in the dashboard and how widgets are displayed in each column.
cells: Object that contains the subcells.
subcells: Object that contains the elements objects where widgets are defined.
elements: This objects contains the widget and defines its dimensions within the data source.
defaultFilters This object defines the default filters of a dashboard. When a user selects "Set as my default filters" from the Filters menu in Sisense, the filters are defined in this object. -
Click POST. The Dashboard is added to the Dashboards list in the Analytics page.