L2023.6 Release Notes
Last updated: June 29, 2025
For a list of release dates and Sisense's end of support schedule, see Sisense Version Release and Support Schedule.
-
To download the latest Sisense version, or to upgrade to an older version, see that version’s Release Notes and contact your Sisense Customer Success Manager for the version package.
-
To upgrade to this version of Sisense:
-
Read the Release Notes of all the versions following your current version, up to and including the version to which you are upgrading.
-
Run a system backup before upgrading. See Backing up and Restoring Sisense.
-
Follow the upgrade procedure in Upgrading Sisense.
-
-
For side-by-side upgrades that require a restore of a backup that has JDBC connections, see Side-by-Side Upgrades with Restoring a Backup with Generic JDBC Connections.
Privacy and Security Information
This release contains several security related updates. We highly recommend upgrading to this latest release to take advantage of any security-related updates and benefit from the Sisense support and warranty. In addition, Sisense strongly recommends regularly testing and auditing your environment after upgrading, and periodically during your subscription term, to ensure all privacy and security settings remain in place.
Customers are responsible for controlling and monitoring your environments and are therefore in the best position to ensure the correct security settings are in place for how you use Sisense products.
Due to the complexity of Sisense products, we strongly suggest that all customers ensure that you understand how all of the privacy and security settings within Sisense work.
If you use Sisense to store/process sensitive data, it is your responsibility to review and test your implementation to ensure you are not inadvertently sharing data with unauthorized third parties. For more information on data security rules, see Data Access Security.
BREAKING CHANGES - WARNING!
Some browsers are potentially planning to disable third-party cookies. This deprecation may cause a breaking change in your solutions with embedded Sisense analytics, such as the user being redirected to the login page and the embedded solution not being loaded. To avoid this breaking change:
-
Use the same domain for the different apps and put it behind a specific path - this will make Sisense cookies not be third-party cookies.
For more information, see Third-Party Cookies.
Analytical Engine: For L2022.9 and later, if a column name has been renamed in the data model, where the previous name was linked to a filter, the filter will report an error of a dimension not found. To fix this, delete the relevant filter and recreate it using the updated column name specified in the data model.
widget.changesMade()
The signature of the widget.changesMade() function was changed for L2022.9. This may cause breaking changes in custom scripts or plugins where it is used. All places using widget.changesMade() or widget.changesMade('someEvent') should be changed to widget.changesMade('someEvent', ['metadata', 'properties_changed']).
The Databricks JDBC driver was updated to version 2.6.29 for L2022.9. After upgrading the driver, the connection string requires an update from:jdbc:spark://<Server Hostname>:443;HttpPath=<Http Path>;TransportMode=http;SSL=1[;property=value[;property=value]]
To:jdbc:databricks://<Server Hostname>:443;HttpPath=<Http Path>[;property=value[;property=value]]
After installing or upgrading to this version, if the connection string in the system is not the required new one, change it to the new one manually.
The Google Adwords native connector is no longer supported because it uses Google APIs that Google deprecated. New installations from 2022.5 and up will no longer contain the Google Adwords native connector. Customers with older versions of Sisense, or who upgrade to 2022.5 or higher can use this workaround: Using Google Ads connector for EC models with CDATA Driver.
As of L2022.9, all API tokens created before L2021.10 must be rotated.
Release Overview
Release L2023.6 provides a number of new improvements to Sisense for Linux.
What's New
This release contains several new features. The following table lists the high-level impact (or potential impact, if any) of each of these features, and how to handle it if upgrading to this version. Continue reading the Release Notes below the table for a detailed explanation of each feature.
| Feature | Issues and Actions to Consider |
|---|---|
| Dynamic Import Query - GA | |
| Infrastructure Changes | |
| Perspectives | By default, if one of the Data Security dependencies mentioned below are not included in the Perspective, the analytics results (for example, Dashboards) will return ALL results, and the data security rules will be ignored. This is similar to what happens when data security on the root model is not modeled properly, (such as including island tables in a model with data security). This behavior can be configured to return an error to dashboard designers. Contact support for further details. |
| Predefined Dashboard Filters for Embed SDK | |
| Self-Contained Multitenancy - Centralized Asset Management |
Dynamic Import Query - GA
Data modelers can add a dynamic table to their live data model that references pre-configured parameters that have been set by an admin in User Parameters. With this dynamic data modeling approach the dashboard designers and viewers can benefit from:
-
Personal data models - A single data model can be shared with multiple designers in which the same column (by name) references different columns in the original data source.
-
Enhanced integration to cloud data warehouses - Call User Defined Functions (UDF) or other cloud data warehouse native functionality from within Sisense to populate the results in a table.
-
Queries to tables with large volumes of data - Add dynamic filters to a large table or SQL operation that would otherwise timeout without the use of filters in the right places.
To find out more how to define user parameters, see Managing Live Dynamic Connections and for how you can use them in a custom import query, see Importing Data with Custom Queries.
Infrastructure Changes
-
Sisense can now also be installed on Rocky Linux 8.7, RHEL 8.8, or RHEL 9.1.
Perspectives
The Sisense Perspective feature allows users to create sub-models that are dependent on their parent data model, while maintaining the independence of their own logical and semantic elements. Perspectives derive their attributes from the parent, and modifications to the parent are automatically reflected in the child object, supporting a single source of truth, without requiring duplicate versions of the data model they are based on.
Perspectives are used to expose dedicated views of a data model to specific groups. This reduces the need to duplicate data and data models while enhancing the self service capabilities, which is especially valuable for complex use cases with many models, analytics assets (dashboards) or a self service dashboard design-based strategy.
Editing Perspectives
When in a perspective, you can tag tables and give descriptions to the tables and columns. The combination of the new list view experience and the existing Tag and Description functionality provides a data catalog experience for Data Designers.
-
Tags - Tags enable you to tag a table with metadata that you can use to organize your data and search for it later.
-
Description - If needed, edit the description to provide additional information.
For more information, see Perspectives Overview and Using Data Model Perspectives.
Perspectives have the following limitations:
-
Perspectives are not supported for Notebooks, Git Integration, and NLQ (Simply Ask).
-
Every change to a Perspective requires rebuilding/publishing of the root data model.
-
Perspectives are only supported for ElastiCubes and live data source connectors that are supported by Analytical Engine.
Predefined Dashboard Filters for Embed SDK
Dashboards can be opened with predefined (JAQL) filters that are included as part of the dashboard.open method. The predefined filters are merged with the existing dashboard filters before the dashboard is loaded.
Merging Dashboard Filters with Predefined Filters
-
All of the unique dashboard filters and predefined filters, (simple or cascading) are used to filter the dashboard when it is loaded.
-
When there are simple dashboard filters and simple predefined filters for the same dimension, then the values (
members) of the predefined filters are used. -
When cascading filters for the dashboard overlap with predefined filters, or cascading predefined filters overlap with the dashboard filters, then the:
-
Cascading filters are separated into separate simple filters
-
Values (
members) of the predefined filters are used if there are both dashboard and predefined filters for the same information.
-
Example
Example of passing a filters array to the dashboard.open() method:

For more information about Embed SDK, see Embed SDK - Getting Started.
Self-Contained Multitenancy - Centralized Asset Management
The release of the new Centralized Asset Management feature is designed to enhance the capabilities of the Sisense multitenancy solution. The feature allows system administrators, while logged into the main tenant, to access, and perform actions on, the organization tenant's analytical assets - data models and dashboards.
Key capabilities and benefits are:
-
Streamlined Asset Management - System administrators can now conveniently view analytical assets created within individual organization tenants directly from the main tenant.
-
Enhanced Editing Capabilities - System administrators have the ability to fully edit analytical assets as if they were the tenant administrator, even when operating at the system level.
-
Improved Flexibility and Control - Empower system administrators to make necessary changes and updates to analytical assets, providing greater flexibility and control over the overall system utilization.
What's Improved
Analytical Engine - Advanced Multipass Support
Formulas with multi-step and measured value calculations are now supported by Analytical Engine.
Example:
(AVG([Brand], SUM(Cost)),ALL(Brand)) calculates the average total cost per brand and ignores any dashboard or widget filters on brand.
Build To Destination (B2D)
Configuring the storage for B2D is no longer done via CLI commands and yaml files. This is now done using REST APIs. See Configuring B2D in Sisense.
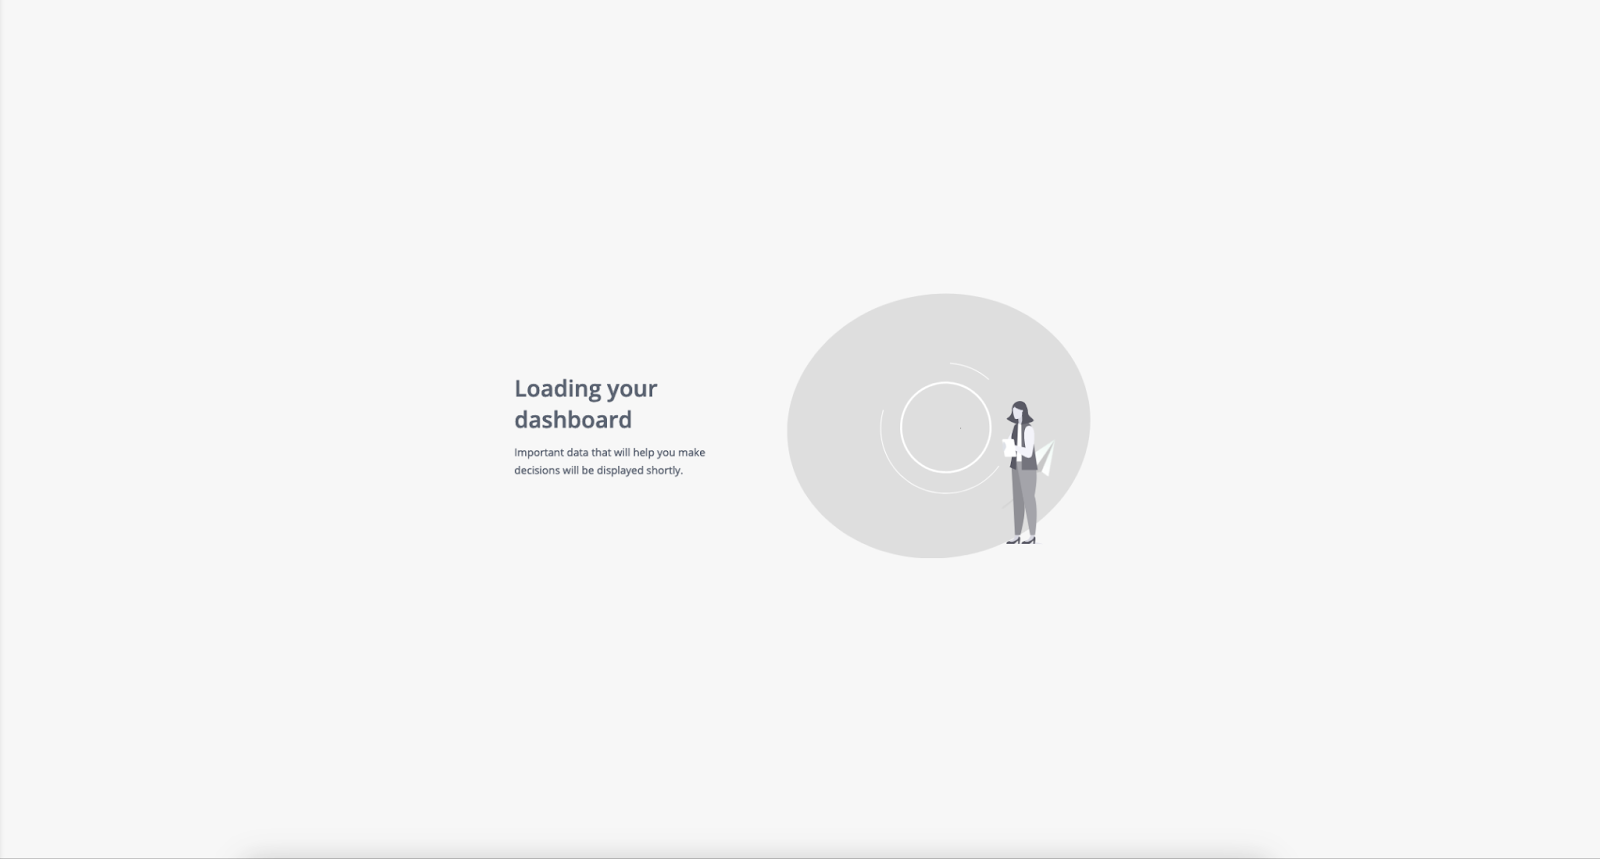
Dashboards
Improved dashboard loading performance with a new animation added.
Note:
As part of the scope of this improvement, the internal property ?metadata=true has been deprecated.
Data Modeling
-
Data Security Improvements
-
A new icon has been added to indicate the tables and columns with Data Security.
-
In the three dots menu, a table/column level action has been added to create Data Security rules directly from there.

-
-
Duplicate Model with Data Security
-
All Duplicate Model operations on the model level from this version will duplicate the Data Security rules as well. This improvement enables customers to speed up their development process and migration process to Live or Direct relations.
-
-
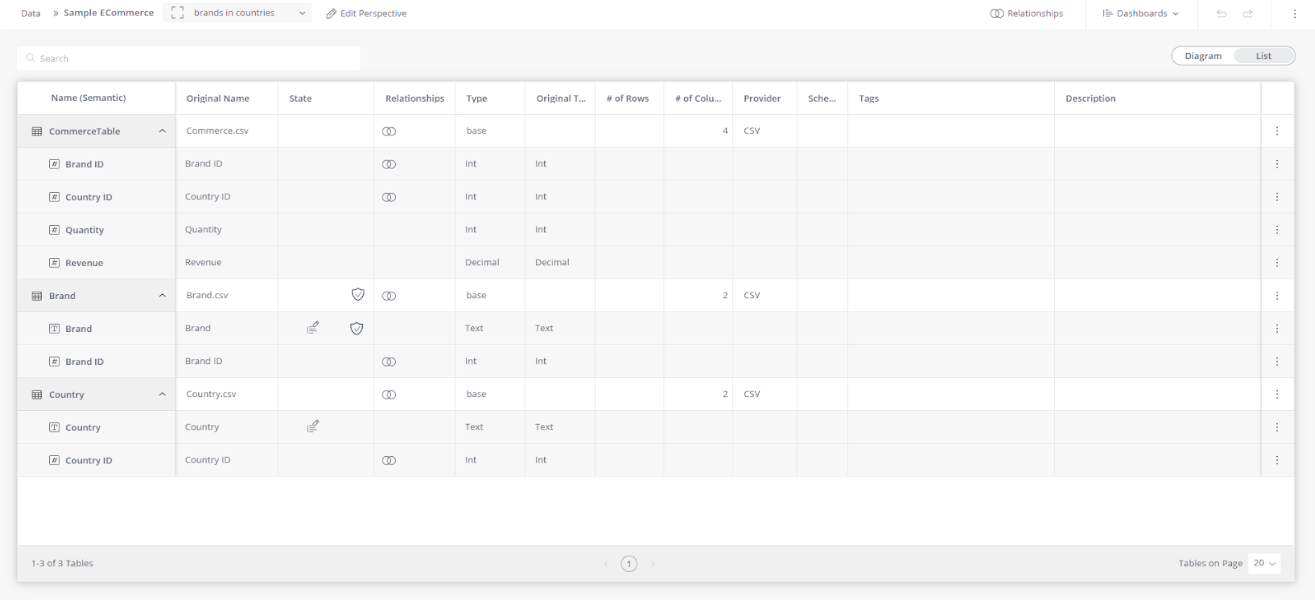
List View
-
The List view editing screen enables you to explore model metadata and semantic data with the same editing capabilities as in the Diagram view.
-
To switch between the List and Diagram views, click the toggle in the upper right corner of the model editor.

As shown in the figure above, the list view displays the following information:
-
Name (Semantic) - The semantic table and column names as they are presented in Analytics.
-
Original Name - Name of the table or column as it was originally found in the data source.
-
State - Displays the table/column status icons (Hidden, Dropped, Indexed, etc.)
-
Relationships - Indicates which table columns are related to other columns in the data model. Hovering over the icon displays a message box with the name of the table column that the column is joined to.
-
Type - The data type. For example: Int, Decimal, Text, etc.
-
# of Rows on the table level
-
# of Columns on the table level
-
Provider - For example: CSV, Snowflake, etc.
-
Schema
-
Duplicate With Direct Relationships
The "Duplicate as Direct" experience has been improved in the following ways:
-
The impact of the migration to Direct is now shown.
-
A new (recommended) option to migrate while removing non-direct relationships has been added.

Export to Excel
When exporting a Pivot widget via the New Export to Excel, there is now a higher modifiable limit to the number of rows and columns that you can export, which you can define for yourself.
-
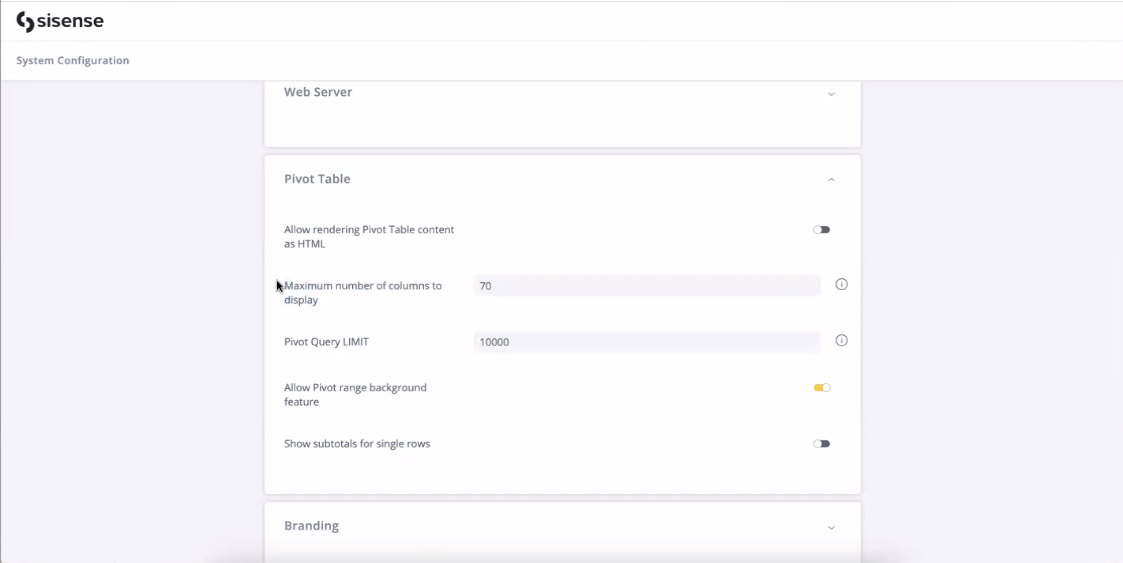
ElastiCube - The Export to Excel limit for EC was previously defined by the Pivot settings for Pivot Query Limit and the Maximum # of columns to display. There are now separate settings for the Pivot visualizations in the dashboard (under the System Configuration settings, in the Pivot Table section) and Export to Excel (under the System Configuration settings, in the Exporting section). The default Export settings are 0 (use Pivot Query Limit and Maximum # of columns to display, for the rows and columns respectively).
Important: Downloading the data to Excel is still limited by the query timeout and browser timeout limits. Pivot structure and complexity factors affect the time it takes to export, but up to 4 million cells (200k rows, 20 columns) are expected to download successfully in most scenarios.
The following image displays the System Configuration settings for Limits for Pivot queries for displaying data on dashboards:
The following image displays the System Configuration settings for Limits for Pivot queries for exporting data to Excel:
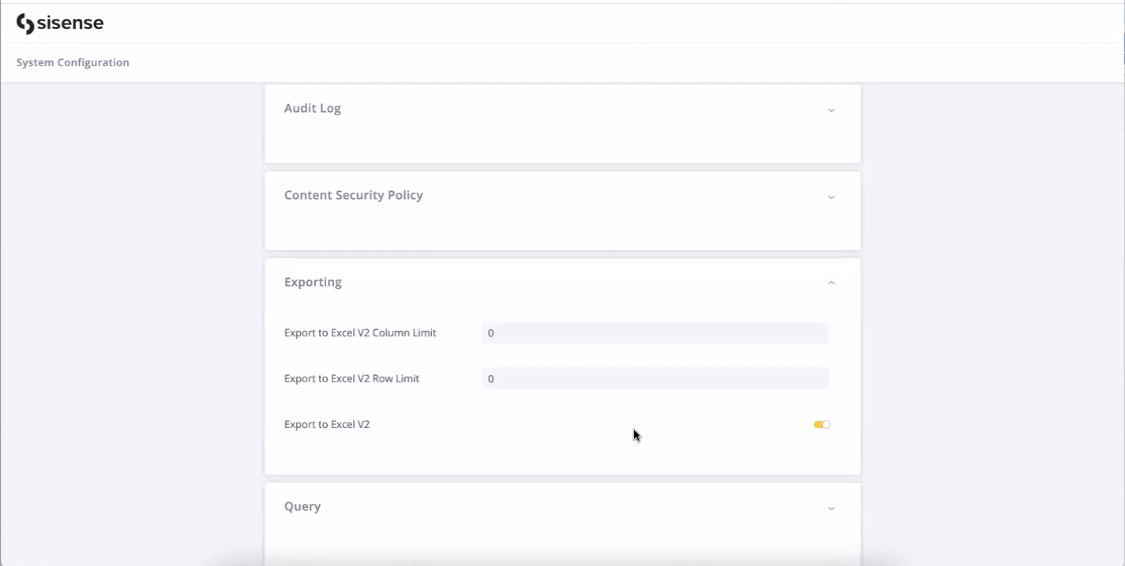
-
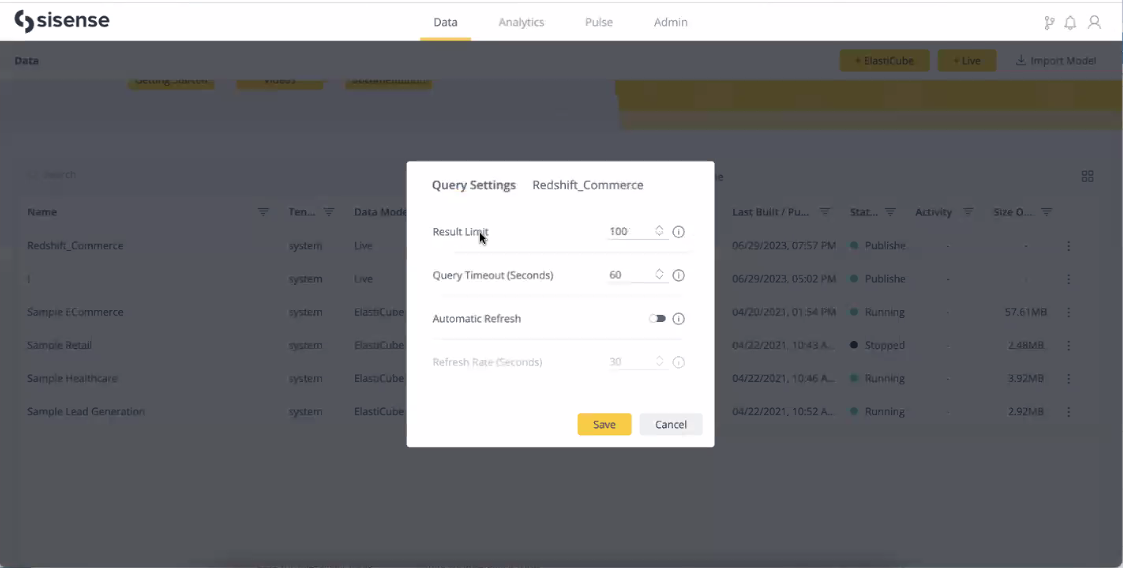
Live - Performance is affected by the data sources. Both the Pivot Query Limit setting for data visualization on dashboards and Export to Excel V2 Row Limit setting will be capped by the Query Settings Result Limit defined for a Live model on which a particular Pivot widget is based. The maximum Result Limit = 50k rows. Effectively:
-
For displaying results in a dashboard, the lower value of the Pivot Query Limit and Live Query Limit is applied.
-
For exporting to Excel, the lower value of the Export Row Limit and Query Result Limit is applied.
Note: If you require exporting more than 50k rows on Live (not recommended), contact support to change your maximum setting.
-
For more information, see New Export Pivot Tables to Excel.
Filters
-
The new filter interface is enabled by default for new installations. Upgrading customers can switch to the default filters from the legacy filter interface by turning on the following filter options in Feature Management:
-
Date / Time Filters
-
Numeric Filters
-
Textual Filters
-
-
Filter relationships now respect the dashboard background filters. Members/Values filtered out by a background filter will not be displayed in the results set, regardless of whether the filter is part of an ‘OR’ condition.
The background filters are displayed in the filter relationship editor as having the default ‘AND’ relationship with the rest of the filters, which cannot be changed. See the image below:
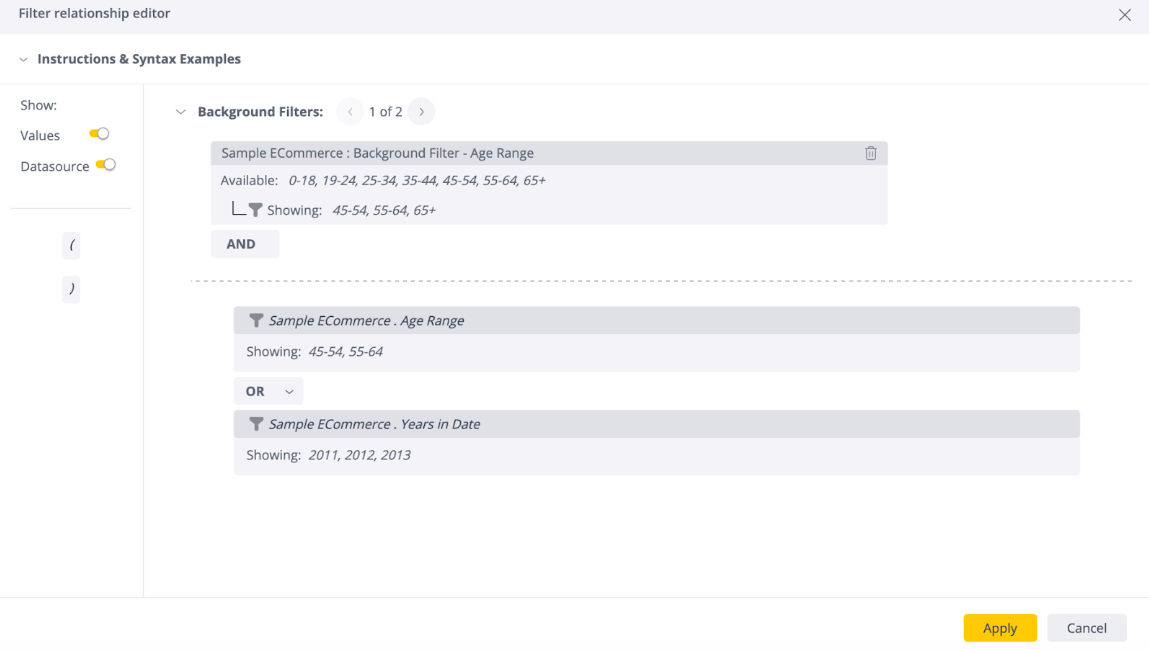
Note:
If you set a widget background filter while a dashboard filter on the same column is a part of an ‘OR’ statement, filtered members/values of the background filter may appear as results matching the ‘OR’ operator.
The filter relationships are enabled by default. Administrators can turn this feature off in Feature Management.
Simply Ask (NLQ)
-
Sisense now has a new NLQ V2 REST API suite, a powerful companion and extension to our popular Simply Ask feature. This suite has been designed to significantly enhance our Natural Language Querying (NLQ) capabilities, whilst providing a versatile setup that breaks free from the constraints of a specific client. This major update enables you to seamlessly integrate NLQ capabilities into your existing workflows, leading to more dynamic and flexible use of Sisense's robust data intelligence platform.
Key Features include:
-
NLQ Query API: Simplify user interaction and bridge the communication gap between humans and machines. Leverage our advanced AI to enable you to ask complex data questions in natural, conversational language and instantly receive data-driven insights.
-
A set of administrative APIs enabling you to easily configure and manage NLQ models and permissions for your specific application's needs. Tailor the NLQ experience to match your specific industry terminology, business rules, and data structures, enabling more precise and relevant responses.
-
-
Improvements have been made to the recommendation menu for recent and favorite queries. Resolved ambiguities will now persist in the menu, enabling you to easily access and select previously resolved queries. This ensures a streamlined experience and saves time by eliminating the need to repeatedly resolve ambiguities.
What's Fixed
Add-ons
-
Jump to Dashboard (JTD) can now open the destination dashboard in the same window if Sisense is embedded in the frame.
-
Filters included in shared formulas are now passed to the target dashboard when using JTD.
-
JTD now works as expected on the Android mobile app when logged in via SSO.
-
The Histogram has been adjusted and is now compatible with low values.
-
Loading dashboards with Dynamic ElastiCubes has been improved.
APIs
-
API call 0.9 (DELETE) /api/groups/{group}/users no longer returns 500 nor freezes the environment. This was only an issue on large scale environments.
-
Passing arguments to the "beforedatapointtooltip" event now works as expected.
-
The API Gateway memory leak, documented in the L2023.3 Release Notes, has been fixed.
Data Modeling
-
Hide Group Size When Sharing Assets
When this toggle is off, the user count in Groups is removed from the model sharing experience.
The default behavior remains unchanged, and will present the Group user count. This toggle has been added to improve search performance on large environments.

-
When there are data security rules on multiple columns with the same name, the Security Shield in Data Model now appears for all security tables/columns, even when there are multiple security tables/columns in the data model.
EmbedSDK
-
Now the dashboard only sends JAQLs after the parent application has updated the filters. This issue was resolved as part of the new predefined dashboard filters functionality. See Predefined Dashboard Filters for Embed SDK.
-
sisenseFrame.getSize()now returns the actual height and width of the dashboard when viewing a frame on mobile and tablet views. -
There is now a default height of 400 px set for containers that do not have it explicitly set in the embedding solutions. As height is essential for the proper functioning of the application, it is highly recommended that you explicitly set the height as per your requirements.
Embedding
-
X-axis labels in embedded solutions are now displayed permanently, and with the same behavior as in the native application.
-
Custom-uploaded fonts are now displayed as expected in embedded solutions.
Explanations
-
Explanations now supports some scenarios where data received from plugins was corrupt and the field names in the "possible explanations" appeared blank.
-
Theme settings are no longer lost when opening the "Explore other fields" window in the Analyze it / Explanations feature.
Export to Excel
The Pivot table exported to Excel with the new exporting service now keeps the number formatting using % when the GrowthPastMonth formula is applied to a column.
Filters
The filter for Next X Days now correctly uses the number input by the user even when greater than 100.
Formulas
Importing a data model with shared formulas using the “Merge Old” Formulas Management setting now works as expected. The shared formulas in the imported data model no longer overwrite existing shared formulas.
For more information, see Exporting and Importing Data Models.
Git Integration
The instanceid property of the filters is now tracked by the Git projects. This means that the scope and settings of filters are imported in full when promoting assets between environments.
Infusion Apps
-
Customers who have upgraded to L2023.4 are now able to log in to Infusion applications.
-
View Management
-
The Change View Name dialogue is now displayed on a white background for better readability.
-
-
Office 365
-
"Add to Worksheet"/"Create Worksheet" now has the same behavior in Office365 as it does in Google. That is:
-
Only the “Add to Worksheet“ button will create a ‘refreshable’ tab
-
The Preview & AskMe dialogs have the “Create Worksheet“ button which creates a new tab
-
If a tab was created with via “Create Worksheet“, it will have a prefix in its name (“Preview” or “AskMe”, respectively)
-
-
-
Ask Me
-
When specifying a filter condition in Ask Me, the function "All" now works properly, and:
-
Is only applied to the appropriate filter.
-
Enables overriding the filter applied to the widget and showing all records.
-
-
PDFs
When exporting to PDF, text widgets’ lengths no longer exceed the maximum window. All widgets now have the same length inside their containers.
REST APIs
The GET folders API now returns all of the folders available for the user, both owned folders and shared folders.
Simply Ask (NLQ)
-
The available fields menu is now collapsed by default, ensuring a cleaner and more focused workspace.
-
Resolved ambiguities no longer reappear as you continue typing a sentence. Smoother and more accurate results are now provided.
Widgets
-
When Widget Design Styling is enabled: The ‘jumpable’ icon is added before the widget’s title, as expected, for the Jump to Dashboard (JTD) and Accordion plugins. See Setting Widget Style for more information about the Widget Design Styling functionality.
-
The Text Widget height is now 100% of the row height, like other widgets.
-
Drilling into calendar-based hierarchies with the datetime dashboard filters now works as expected.
-
The RSUM function while using Break By years now works as expected.
-
Manually set column widths in Table and Pivot widgets are now persistent after widgets refresh or when opening widgets in Edit mode.
Limitations
Creating Pulse alerts are blocked on value based on / includes utilization of the functions CONTRIBUTION() and RSUM().
Known Issues
Multitenancy - Data Security
When creating two live models with the same name in different tenants, data security cannot be added for either one. This is expected to be fixed in version L2023.9.
Side-by-Side Upgrades with Restoring a Backup with Generic JDBC Connections
When importing a data model, or opening an existing data model, the old connectors pod must be up already, otherwise the JDBC connection will be blank.
For side-by-side upgrades that require a restore of a backup that has generic JDBC connections, do not perform the restore until after you perform the following steps:
-
Install Sisense.
-
Activate Sisense.
-
Scale up the connectors pod.
-
Restart the query pod.
-
Only after the previous steps have been performed, now perform the Sisense restore from a Sisense backup.
Video
Watch this video for an overview of selected features from this release: