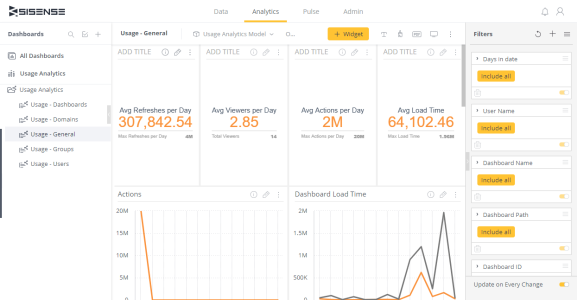
Usage Analytics
Sisense Usage Analytics is a set of predefined dashboards and ElastiCubes that enable you to monitor your Sisense user and dashboard activity. With Sisense Usage Analytics, you can better understand how users are interacting with Sisense dashboards and optimize your configuration accordingly. For example, you can understand which dashboards are making an impact and how fast the dashboards are loading.
See the Usage Analytics training course for more information.
Sisense collects usage data for the following actions:
- Opening a dashboard
- Changing a filter
- Selecting areas (filter)
- Drilling down into widgets
- Exporting a dashboard to PDF
- Adding KPIs to Pulse
The data displayed in your Usage Analytics dashboards is collected once Usage Analytics is enabled. Therefore, when you first enable the feature, there will only be a small amount of data. The data is stored on your Sisense server.
Sisense Usage Analytics includes the following dashboards:

- Usage - Dashboards: Provides insights regarding the active dashboards in the retention period in your system, how often they are used, and their performance.
- Usage - Domains: Provides insights regarding the behavior of your users, from different email domains in your system. This is useful for OEMs who have tenants from different email domains. From this dashboard you can monitor system usage for each tenant.
- Usage - General: Provides a general summary of dashboard performance, dashboard usage, and who is viewing your dashboards.
- Usage - Groups: Provides insights regarding group activity in your system and their dashboard usage.
- Usage - Query: Provides insights regarding queries created by users.
- Usage - Users: Provides insights regarding the behavior of specific users in the system.
Note:
Filtering by the Tracking tag is currently only compatible with WAT usage.
For advanced build analytics, there are two dashboards:
- Build Usage Overview: Provides insights for data admins into the build usage at a high-level and identifies usage and/or performance anomalies - Daily average build, success rate, how many cubes are built daily, performance.
- Build Usage Failures: Provides insights into build failures to help you detect the cause of the failures quickly, such as specific cubes not working, overload to system or errors in the system

There are several calculations included in the Usage Analytics cube:
-
On Usage table:
-
loadTime - load time for the dashboard, from the start of initialization until the dashboard triggers the 'domready' event.
-
-
Upon 'FinishQuery':
-
duration - entire query duration, from API call to the time the result is returned.
-
translationduration - the time spent in Translator, JAQL to SQL.
-
dataSourceExecuteDuration - the time spent in Query execution, from SQL to result set.
-
The Usage Analytics dashboards included with Sisense are visible after you Enabling Usage Analytics the Usage Analytics feature in the Admin page. After activating Usage Analytics, Sisense displays the default Usage Analytics ElastiCube in the Data page and your default Usage Analytics dashboards in the Analytics page.
You can fully customize the default ElastiCube and dashboards as you like.
Note:
The Usage Analytics ElastiCube is built on a CSV file where your data is stored. This CSV cannot be modified in any way, or the ElastiCube will not build. To update the Usage Analytics data, you must perform a full build.
In the Usage Analytics dashboards, the following actions are tracked, along with explanations of what triggers each one:
-
filter.change - triggered if the dashboard's filters are changed during the dashboard update
-
export.image - triggered for manual (when a user clicks the download button) and automatic (e.g. image generation for email) actions
-
export.pdf - triggered for manual (when a user clicks the download button) and automatic (e.g. PDF generation for email) actions
-
export.csv - triggered for the export of the widget to CSV
-
page.navigate.data - triggered when a user opens the 'Data' page
-
page.navigate.analytics - triggered when a user opens the 'Analytics' page
-
page.navigate.pulse - triggered when a user opens the 'Pulse' page
-
page.navigate.admin - triggered when a user opens the 'Admin' page
-
dashboard.load - indicates the start of the dashboard loading. Two events,
dashboard.loadanddashboard.loaded, should be triggered for one dashboard. They allow calculatingloadTimeof the dashboard which isdashboard.loaded.timestamp-dashboard.load.timestamp. -
dashboard.loaded - indicates the end of the dashboard loading. Two events,
dashboard.loadanddashboard.loaded, should be triggered for one dashboard. They allow calculatingloadTimeof the dashboard which isdashboard.loaded.timestamp-dashboard.load.timestamp. -
action.pulse - is triggered when a new pule alert is created
If you modify your ElastiCube and it no longer builds, or if you ever need to revert back to the original ElastiCube and dashboards, you can do so through the Admin page or through the REST API. See Enabling Usage Analytics for more information.
Note:
Groups with ';' in their name will lead to incorrect data being displayed in your Usage Analytics as this causes the groups to be parsed as two separate groups.
Training Course
Click here for the Usage Analytics training course.