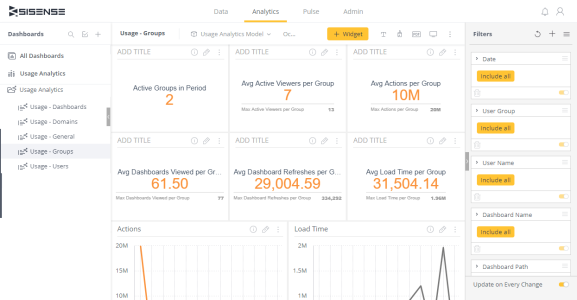
Groups Analytics
The Usage - Group dashboard provides you with insights regarding your Sisense groups. This dashboard is useful to see which groups are active and check the system performance for dashboards for your groups.

The Usage Domain dashboard contains data regarding how many groups were active for the recorded period of time, how often they are using your dashboards, and what type of dashboard load performance your users are experiencing.
You can filter the information displayed in your widgets with a set of filters on the right. With these filters, you can filter the details displayed in your dashboard by each user, group, or dashboard.
With the Group Analytics dashboard, you can keep track of your groups and remove or edit any groups that are not being used.
This dashboard is useful for answering the following questions:
| Question | Widget |
|---|---|
|
How many active groups do I have? |
Active Groups in Period, Dashboard Refreshes and Viewers |
|
Can unnecessary groups be deleted? |
Active Groups in Period, Avg Active Viewers per Group, Dashboard Viewers per Group |
|
How many active users are in a group? |
Avg Actions per Group, Actions, Dashboard Refreshes and Viewers |
|
How many actions does a group perform? |
Avg Actions per Group, Actions |
|
How many dashboards were viewed by a group? |
Avg Dashboards Viewed per Group |
|
How many times was a dashboard refreshed by a group? |
Avg Dashboards Refreshed per Group |
|
Whats the dashboard load time for my groups? |
Avg Load Time per Group, Load Time |
|
Who is in my groups? |
Dashboard Viewers per Group |