Enabling Usage Analytics
Last updated: June 10, 2026
| Tier | Deployment |
|
|
|
There are two steps to activating User Analytics. The first step is to enable Usage Analytics from the Admin page, and the second step is to build the model called Usage Analytics Model that is automatically created when Usage Analytics is enabled.
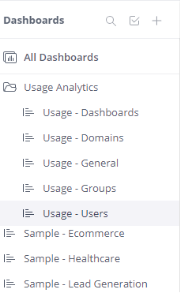
Once Usage Analytics is enabled, your server's activity is recorded on your Sisense Server. Enabling Usage Analytics adds a Usage Analytics ElastiCube to the Data page and a Usage Analytics folder to your Dashboards list where all the pre-defined usage dashboards are stored.
These dashboards are initially empty until you complete the second step, which is to build the pre-defined Usage Analytics model. After you build your Usage Analytics model, your Usage Analytics dashboards will display the updated usage data. The data displayed in your Usage Analytics dashboards is collected when Usage Analytics is enabled. All the data displayed in your Usage Analytics is stored on your Sisense Server for 30 days.
Note:
If you want to retain the usage analytics data for more than 30 days, use the SQL API to export the data to a CSV file. The syntax for the command you need to perform is:
http://{IP}:30845/api/datasources/Usage%20Analytics%20Model/sql?query=select%20*%20from%20usage&format=csv
Note:
To display the latest usage analytics data, you need to perform a full build on the Usage Analytics model. You can automate this step by Scheduling Builds.
To activate Usage Analytics:
- In the Admin page, search for Usage Analytics, which is located under Monitoring
& Support.
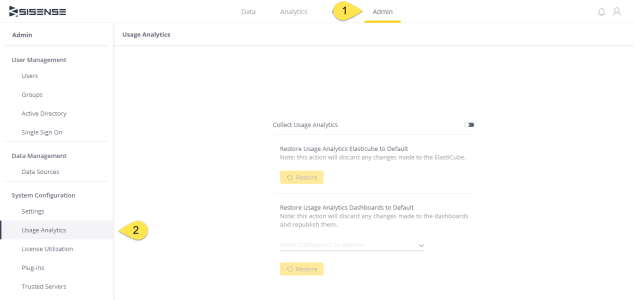
- Toggle Collect Usage Analytics to enable. Sisense automatically adds the Usage Analytics Model to your Data page.
-
Enter the number of days you want to retain data for and click Save.
.png)
Note:
Increasing the number of days to more than 30 may affect system performance and use up more disk space, particularly during building the cube. It is recommended to test the cube for stability, capacity and performance before scheduling frequent builds
-
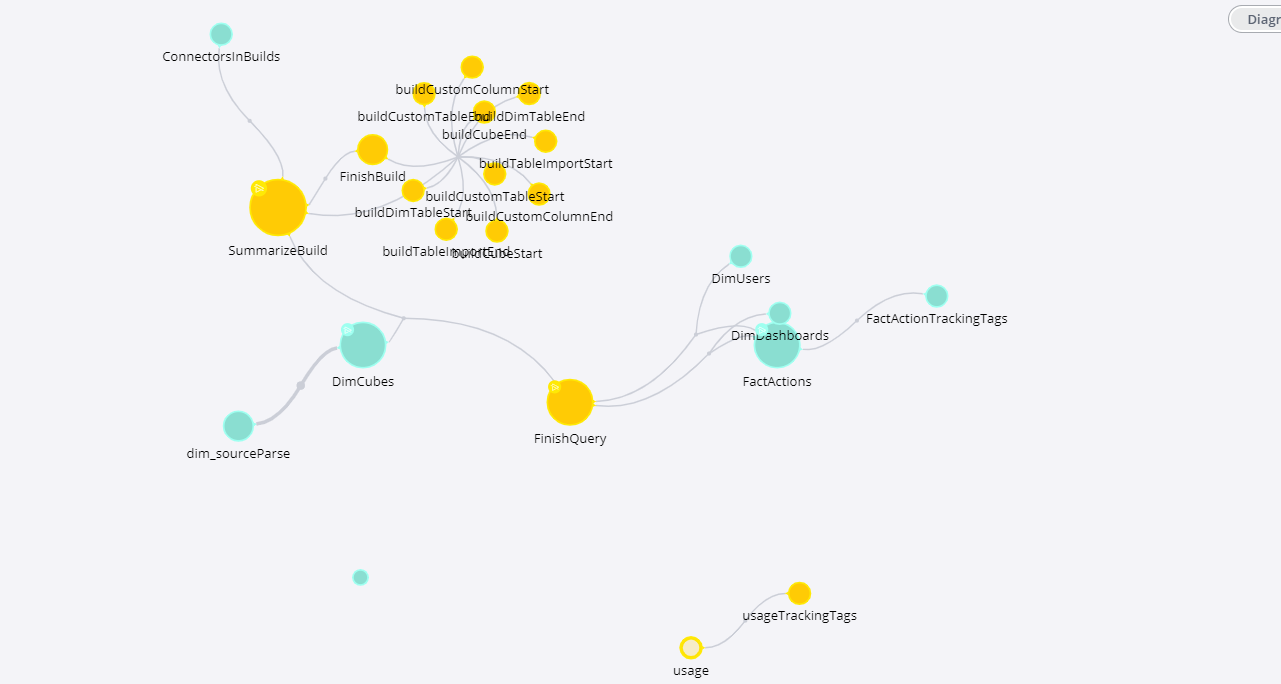
In the Data page, open the Usage Analytics Model.
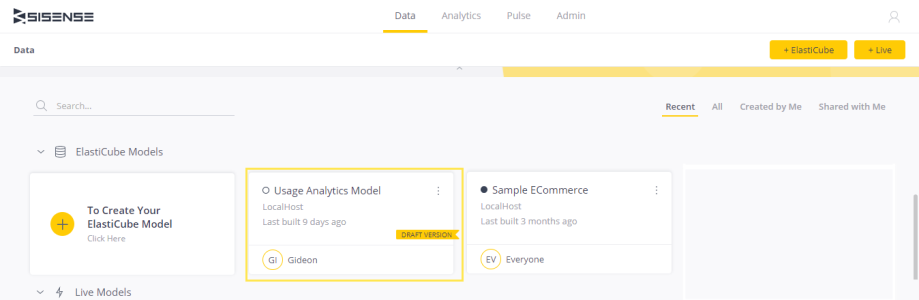
- Build the Usage Analytics Model. Your Usage Analytics dashboards display all the information collected since you began collecting usage analytics data. To update your dashboards with the latest data, you need to run a full build each time.
Usage Analytics Actions
The following actions are available for the usage analytics and when the action is triggered:
| Action | Description |
|---|---|
| action.pulse | A new pulse alert is created. |
| dashboard.load | Indicates the start of the dashboard loading. The dashboard.load and dashboard.loaded actions are triggered for the dashboard, and allow for calculating the dashboard loadTime, which is dashboard.loaded.timestamp - dashboard.load.timestamp. See Limitations below. |
| dashboard.loaded | Indicates the end of the dashboard loading. |
| export.csv | The widget exports to CSV |
| export.image | Manual (clicking the download button) and automatic (e.g. image generation for email) export actions. |
| export.pdf | Manual (clicking the download button) and automatic (e.g. PDF generation for email) export actions. |
| filter.change | The dashboard's filters are changed during the dashboard update. |
| page.navigate.admin | A user opens the Admin page. |
| page.navigate.analytics | A user opens the Analytics page. |
| page.navigate.data | A user opens the Data page. |
| page.navigate.pulse | A user opens the Pulse page. |
Limitations
-
When a user is renamed or the role is changed, dashboards that count actions, such as
dashboard.load, will return duplicated counts. However, Grand Totals per user ID remain accurate despite duplication in individual counts.