General Analytics
Last updated: June 10, 2026
| Tier | Deployment |
|
|
|
The Usage - General dashboard provides you with insights regarding your Sisense system, including how often Sisense is being used and its performance.
You can filter the information displayed in your widgets with a set of filters on the right. With these filters, you can filter the details about your system activity by an individual dashboard or per user or group.
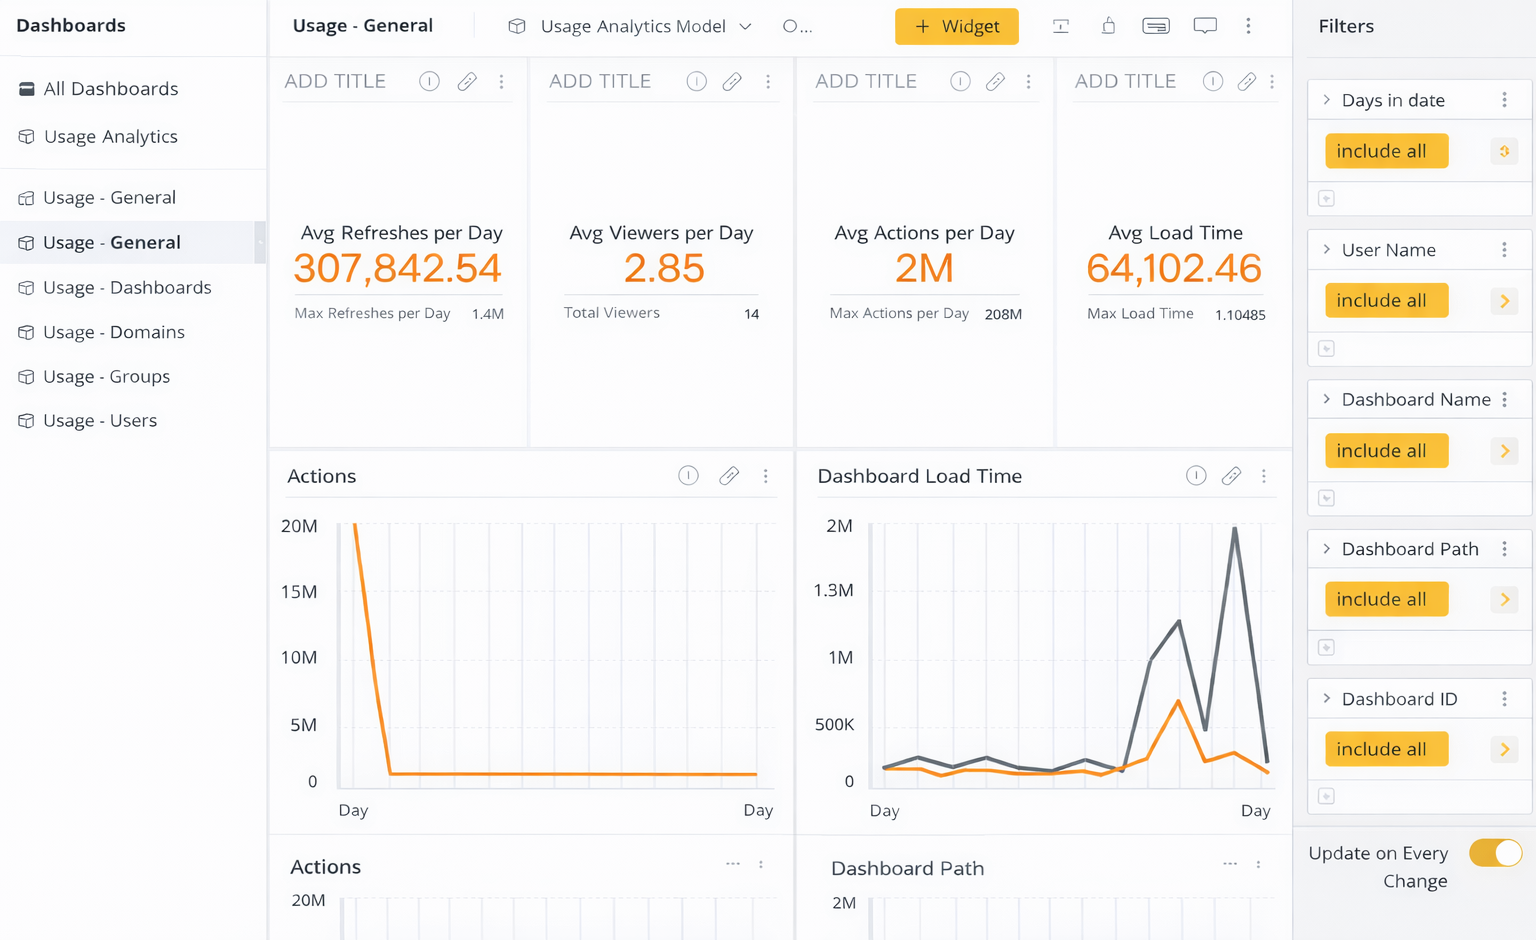
This dashboard is useful for answering the following questions:
| Question | Widget |
|---|---|
|
How often are dashboards being refreshed? |
Avg Refreshes per Day, System Usage |
|
How many Viewers are active each day? |
Avg Viewers per Day, System Usage |
|
Have many actions occur in my dashboards per day? |
Avg Actions per Day, Actions, System Usage |
|
How long does it take to load a dashboard? |
Avg Load Time, Dashboard Load Time, System Usage |
|
Which dashboards are being viewed? |
Dashboard Viewers |
|
Who is viewing my dashboards? |
Dashboard Viewers |