Sisense Analytics for Slack
Setup and Configuration
Infusion Apps and Sisense Analytics for Slack must be enabled on that instance. Refer to Enabling Infusion Apps before starting.
Roles and Responsibilities
To complete setup and configuration, you will need:
-
An individual who is able to create an app from https://api.slack.com/
-
A Sisense Admin to provide app credentials to Sisense
-
A Slack Workspace Owner to deploy the app to the Workspace
Review the documentation to ensure that you understand who within your organization is required to be involved.
Creating a Sisense-branded Slack App
-
Visit https://api.slack.com/.
-
Click Create an app.
-
From the options provided, select Start from scratch.
-
Navigate to Basic Information > Display Information.
-
Name your application Sisense Analytics and select a workspace from the list.
-
Copy and paste into the Short Description field: Sisense Analytics for Slack.
-
Copy and paste into the Long Description field: Sisense Analytics for Slack allows users to ask questions of their Sisense data, directly from Slack.
-
Add the Sisense logo provided here.
-
Select Black #000000, Sisense Blue #005596 or White #FFFFFF as the background color.
Creating a White Labeled Slack App
You are only permitted to distribute the Slack Infusion App with a non-Sisense image if your sales order for Infusion Apps includes "white labeling" in the Product table.
If you are unsure if your sales order includes "white labeling" in the Product table, please contact your Customer Success Manager.
-
Visit https://api.slack.com/.
-
Click Create an app.
-
From the options provided, select Start from scratch.
-
Name your application and select a workspace from the list.
-
Upload your non-Sisense image.
-
Select a background color.
Sharing App Credentials with Sisense
-
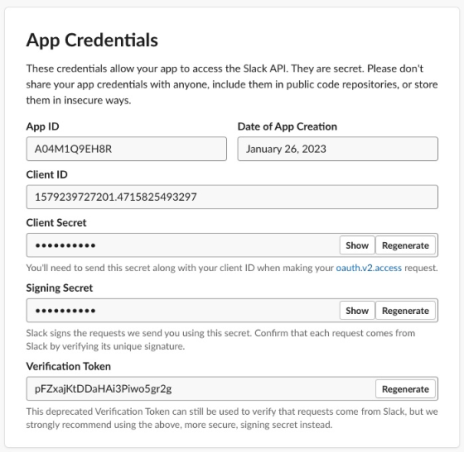
Select Settings > Basic Information > App Credentials.
Slack will generate the following:-
Client ID
-
Client Secret
-
Signing Secret
-
-
Copy the Client ID, Client Secret, and Signing Secret.
-
Paste them into the corresponding fields in the App Configuration > Infusion page.
-
Verify the values, as validation will not be performed on the field contents.
Adding Scopes and Redirect URL
-
Navigate to Features > OAuth & Permissions.
-
Scroll to Scopes.
-
Click Bot Token Scopes > Add an OAuth Scope.
-
Search for and add the following scopes:
-
chat:write
-
app_mentions:read
-
channels:history
-
channels:join
-
channels:read
-
conversations.connect:read
-
im:history
-
im:read
-
im:write
-
-
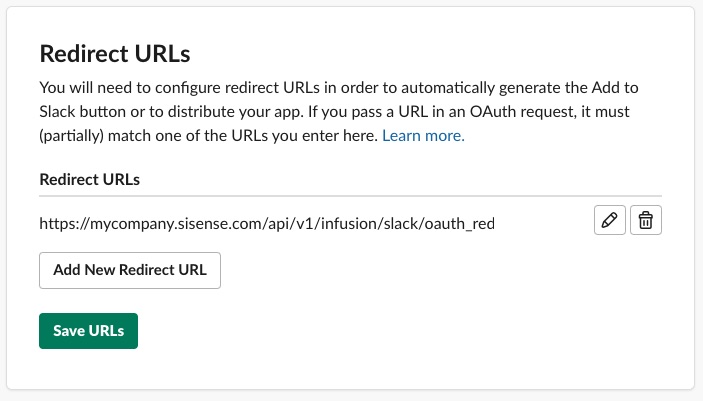
Scroll to Redirect URL.
-
Click Add New Redirect URLs.
-
In the Redirect URL field, replace <sisense_url> with your Sisense instance URL, as follows: <sisense_url>/api/v1/infusion/slack/oauth_redirect
Redirect URL Examplehttps://mycompany.sisense.com → https://mycompany.sisense.com/api/v1/infusion/slack/oauth_redirect
-
Click Save URLs.
-
Click Add.
Enabling Messages
After adding Scopes, the Messages tab is automatically enabled.
-
Navigate to Features > App Home > Show Tabs.
-
Verify that the Messages tab is enabled. If not, enable it via the toggle.
-
Mark the Allow users to send Slash commands and messages from the messages tab check box.
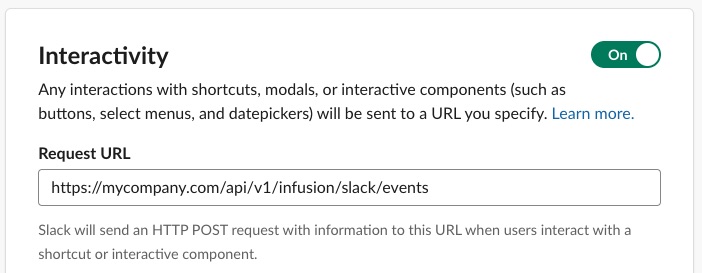
Enabling Interactivity
-
Navigate to Features > Interactivity & Shortcuts.
-
Enable Interactivity via the toggle.
-
In the Request URL field, replace
<sisense_url>with your Sisense instance URL.Request URL Example<sisense_url>/slack/events → https://mycompany.sisense.com/api/v1/infusion/slack/events
-
Click Save Changes.
Subscribing to Events
-
Navigate to Features > Event Subscriptions.
-
Enable events via the toggle.
-
In the Event Subscriptions field, replace <sisense_url> with your Sisense instance URL, as follows:
<sisense_url>/slack/events → https://mycompany.sisense.com/slack/events
-
Expand Subscribe to bot events.
-
Click Add Bot User Event.
-
Search for and add the following events:
-
app_home_opened
-
app_mention
-
message.im
-
message.channels
-
Installation and Access
Installing and Distributing
Your Slack App must be installed to your Slack Workspace.
-
Navigate to Settings > Basic Information.
-
Click Install to Workspace.
Additionally, you may want to configure app distribution or enable app approval.
Note: Do not submit the application to the Slack App Directory.
Users Getting Access
Slack users can add Sisense Analytics for Slack to their individual accounts.
-
In the Slack Sidebar, scroll down to the Apps section.
-
Click the + icon.
-
Search for the app name.
-
Click the app tile.
Once Sisense Analytics for Slack is available in your sidebar, you can log in to begin.
-
Type Login.
-
Provide the email address and password associated with your Sisense account.
-
Click Connect.
All Infusion Apps support Single Sign On (SSO), and will respect the SSO settings/configurations of your instance. Some instances may not require users to provide an email and password if already logged in via SSO. Learn more about Single Sign On here.
To log out of Sisense Analytics for Slack, type the word Logout and follow the confirmation prompt. There is no forced logout, so users can stay logged in indefinitely while still logged in to Slack.
Using Sisense Analytics for Slack
Asking Questions
Sisense Analytics for Slack uses “Ask Me” to take questions submitted by a user, query data within Sisense, and return an understandable, friendly response. Using natural language makes asking questions of data more approachable to less technical business users.
Slack is best used to perform small, ad-hoc queries as opposed to deep or complex data analysis.
Users should start by understanding which Views are available to them, in order to know what kinds of questions they can ask. Using the command/word show views, Slack will display a list of Views and their descriptions.
The columns and filters displayed are intended to help users understand what data is included in the View, that they can ask questions about, and how to ask their questions. Ask Me requires that users follow some syntactical rules when asking questions.
In Slack, responses to questions are returned in a list format, but can be viewed as a visualization when aggregated. The data displayed in the list output corresponds to how the columns are configured within the View.
Availability of Data
Data coming from an ElastiCube will refresh based on the build schedule of the cube. Data coming from a Live model will refresh with new data each time the user queries a View.
This means that depending on the build schedule, or how often the data in your live model changes, and how often you query data, you may not see changes in the data that you expect.
If you expect to see changes in data, but are not seeing them, contact your administrator.
Saving Questions for Repeated Use
In some cases, users may ask similar, or even the same, questions over and over again.
A query can be saved as a Bookmark and referenced at any time by entering the command show <bookmark name>. All Bookmarks can be viewed by typing show bookmarks. Bookmarks are saved for each user, but questions can be shared and then bookmarked by others.
See Using Bookmarks for more information about creating and managing Bookmarks.
Exploring Aggregated Data
Aggregating the Results
Views, Bookmarks, and Questions can be aggregated in order to see results in a different way. Using the Analyze function provides a summary and a visualization of the data. Aggregation can be performed by asking a question and clicking Analyze or prepending a question with the command analyze <View name> or <Bookmark name>.
In order for the Summary to return accurate results, Analyze requires the definition of a Unique Identifier and a Default Measure when creating the View. View Creators can add additional configurations such as aggregations and date filters in order to enrich the results. To ensure the Analyze and Summary feature works properly for users, see Creating & Configuring Views.
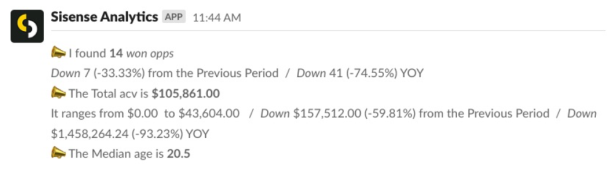
Summary
The Summary presents a summary of data within the View, Question, or Bookmark. The Summary may include some or all of the following, depending on the configuration of the View and the question being asked:
-
Distinct Count
-
Aggregations
-
Range of Minimum and Maximum
-
A past period and year-over-year
Visualizations
Accompanying the Summary, visualizations are generated and displayed natively in Slack. Visualizations are interactive and allow you to dynamically change the measures and dimensions displayed on the x- and y- axes.
| Definition | Example | |
| Measure | A field that contains quantitative values that you can measure | Numeric data |
| Dimension | A field that contains qualitative values | Names, Dates, or Geographic data |
The chart provides the top 10 results, broken down based on the selections in the drop-downs. You can select a measure or dimension other than that which was originally shown. The options displayed in the drop-downs are determined by the View’s configuration.
Depending on the dimensions selected, the visualization is displayed as a bar chart or a time series chart.
Sharing your insights with others
You can share your insights with others by clicking Share at the bottom of each result set.
The results of a question can be shared with one more users or channels, and must include a message from the sender. The recipient must have Sisense Analytics for Slack installed in order to receive the message. Messages will be sent and received within the Sisense Analytics app.
Note: Sharing aggregated results is not currently supported.
Troubleshooting
-
If you believe your Summary is not reporting properly or missing information, contact your View creator.
-
Infusion App installations occur outside of the Sisense instance. Sisense Support does not assist with client installation of Infusion Apps. If you need additional assistance, open a ticket with Slack Support or refer to Slack Documentation.