Creating Views
Last updated: December 16, 2025
Offering: Cloud, On-Prem
This article details the last step before Infusion Apps are ready to be used by your organization. In order to use Infusion Apps, one or more views must be created. It also provides best practices for using views.
In order to get the most out of your Infusion Apps, you must enable publishing data via views. The "View" is a new concept introduced for Infusion Apps. Views are tabular datasets with a defined set of columns and filters that is created using a Table or a Table with Aggregation widget from a dashboard. Views support data from both Live and ElastiCube data models. The NLQ engine used by Infusion Apps queries the View, and not the Data Model.
A view is a perspective generally aligned to a business department, or business use case. Views are created and edited in Sisense, and exposed for end-users in all Infusion Apps. Views appear in Infusion Apps, while respecting Access & Security as sources of data for the user to explore.
Creating Views
Prerequisites:
- The Publish View add-on must be Enabling Infusion Apps.
- A view can only be created by a Dashboard Designer within the Sisense Web Application.
To create a view:
- Create a dashboard to contain your views.
Note:
One or more views can be created and stored on a Dashboard. It is recommended to create a new dashboard for the purpose of containing views. It is not recommended to mix views and widgets on self-service dashboards (i.e., operational dashboards used for consumption). See View Creation Best Practices for more information.
- Choose your data source:
- Choose a data source that contains the data that you want to expose in your view.
- Each view can use a different data source that is already supported by the dashboard.
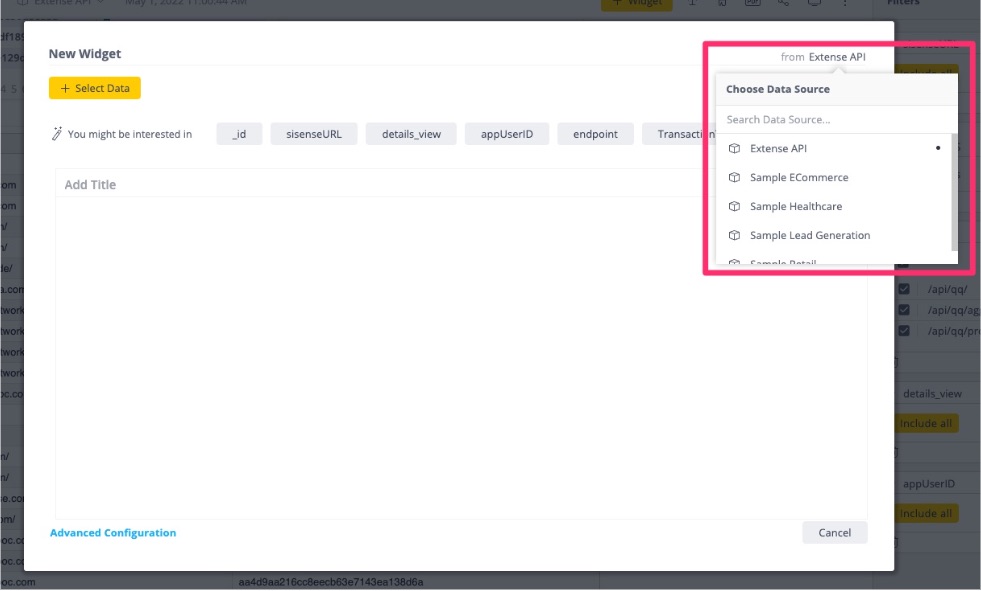
- Select data and create a widget with the chart type Table or Table With Aggregation.
Note:
- Pivot tables, charts, and indicators cannot be used as views.
- In order to see/use the Table with Aggregation widget type, an additional plugin must be installed.
- Add columns and Creating Widget Filters. The columns and filters selected here do not just help to curate the view; they are exposed to the user within the Infusion Apps.
- Click Apply.
- Click the Edit icon.
- Publish the widget as a view:
- Click the three-dot menu and select Publish as View.
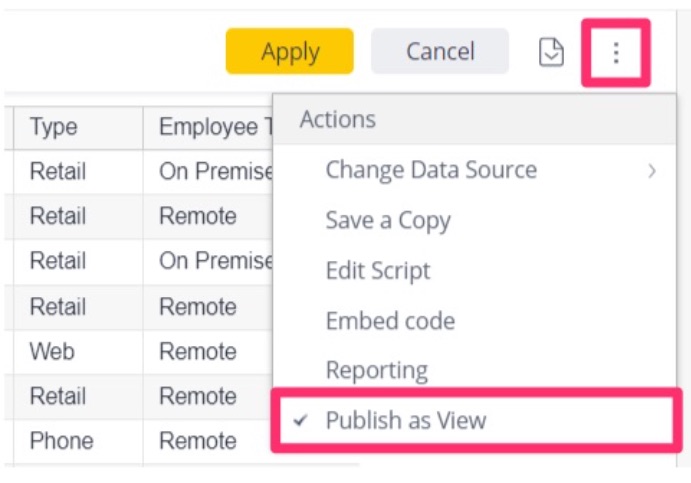
Note:
If you do not see this option, the PublishView add-on may not be installed. Contact your Sisense administrator.
- Provide a unique name and a description for the view. This view name and description will be visible to the user in the Infusion Apps.
Note:
View names support:
- a-Z
- numbers
- spaces
- special characters: !@#$%^&*()-+,.;:"'\/
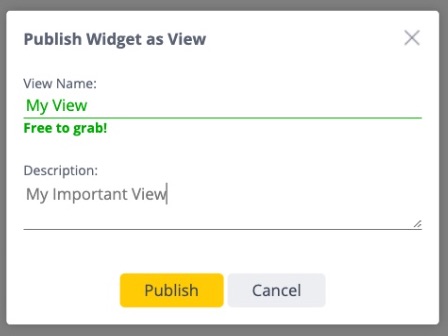
- Click Publish.
- Click Apply.
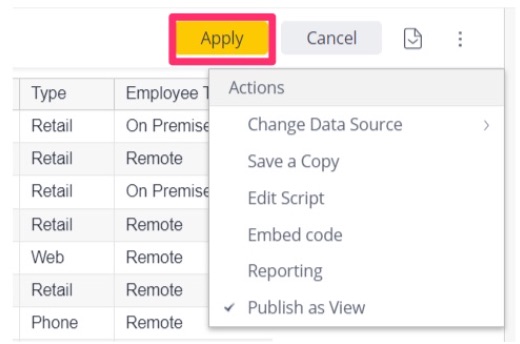
- Click the three-dot menu and select Publish as View.
When a view is published in Sisense, it immediately appears in all Infusion Apps and to users according to existing data security and user access rules.
Note:
Views exclude dashboard filters.
Modifying Views
If you would like to change a view after it has been published, you must apply the changes to the widget and republish the dashboard for the changes to take effect. Changes to the view will be reflected immediately.
Deleting Views
Views can be deleted in the same way that widgets are deleted:
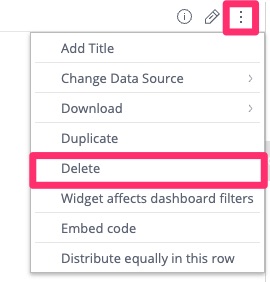
- Click the three-dot menu on the widget header, or in Edit mode.
- Select Delete.
- Confirm the deletion.
Note:
- It is recommended to delete all views first, and then delete the dashboard.
- Deleted views are immediately removed from all Infusion Apps. Users do not receive a notification that a view has been deleted. Any charts supported by a deleted view will break.
View Creation Best Practices
View Management
One or more views can be created and stored on a dashboard.
- It is recommended to create a new dashboard for the purpose of containing views.
- It is not recommended to mix views and widgets on self-service dashboards. Widgets for views are not useful on a dashboard; however, they must be contained in a dashboard. Therefore, mixing views and widgets on a dashboard effectively decreases the value of the dashboard.
View Names
Views are exposed to users exactly as they are defined, so name each view as descriptively as possible.
- Keep names short and concise.
- Provide a meaningful description.
Limit the Number of Views - Less is More
Creating too many Views attempting to cater to every micro-perspective can be counter-productive. Creating and managing the views takes time, and Infusion Apps are intended to save time.
- Utilize user permissions and data security rules to ensure the correct data and views are seen by the correct users.
- As a rule of thumb you should have no more than 3-4 views per Business Area. Typically 1 global view and 2-3 high level stateful perspectives.
- For example: For Sales Opportunities - All Opps, Won Opps, Lost Opps, Active Opps
- For example: For Support Tickets - All Tickets, Open Tickets
Do Not Mix Views and Widgets
Do not mix views with widgets on operational dashboards.
- Views are not meant for operational consumption, and can take up valuable space and confuse viewers.