Sisense Analytics for Office 365
Setup and Configuration
Infusion Apps and Sisense Analytics for Office 365 must be enabled on that instance. Refer to Enabling Infusion Apps before starting.
Roles and Responsibilities
To complete setup and configuration, you will need a:
-
Sisense Admin to download the manifest file
-
Microsoft Global Admin to update, install, and deploy the manifest file
Review the documentation to ensure that you understand who within your organization is required to be involved.
Generating a Manifest
A Microsoft Excel manifest file can be downloaded from Admin > Infusion Management > Sisense Analytics for Office 365. The zip file includes one file: 365-manifest.xml
Once you have downloaded the manifest:
-
Search the manifest for any fields with <sisense_url>.
https://mycompany.sisense.com >
DefaultValue="https://mycompany.sisense.com/plugins/office365/assets/Sisense-Logo-128.png"/>

Configuring Single Sign On
All Infusion Apps support Single Sign On (SSO), and will respect the SSO configurations of your Sisense instance. Your SSO provider URL must be added to the application manifest under AppDomain in order to allow requests to be sent and received through your SSO provider.
-
Add a new AppDomain field, under <AppDomains>, following the existing AppDomain field(s) in your manifest file:
-
<AppDomain>Sisense SSO Provider URL</AppDomain>
-
Replace “Sisense SSO Provider URL” with your full SSO provider URL.
<AppDomains>
<AppDomain>mycompany.sisense.com/plugins/office365</AppDomain>
<AppDomain>https://mycompany.okta.com/oauth2/aus2fsix1lOMIDM2k357</AppDomain>
</AppDomains>
Generating a Manifest for a Sisense-branded Excel Add-on
Once you have completed the steps above (Generate a Manifest, replace all instances of sisense_url, and optionally Configure Single Sign On), you will have a manifest for a Sisense-branded Excel Add-on.
To generate a manifest for a white labeled Excel add-on, additional steps are required - see below.
Generating a Manifest for a White Labeled Excel Add-on
If your sales order for Infusion Apps includes "white labeling" in the Product table, you are permitted to update the “versionNumber” and make changes to the following fields in the manifest file circled in red in the image below. Otherwise, you are not permitted to make any changes to the content of the manifest file.
If you are unsure if your sales order includes "white labeling" in the Product table, contact your Customer Success Manager.
Replacing Manifest Fields
If white labeling, you should change fields in the manifest so that your app/bot displays the correct information for your desired look and feel.
-
DisplayName
-
Description
-
SupportUrl
-
Resources
Replacing Icons
If icons are not replaced, the app will display Sisense logos. To replace icons as they appear in Microsoft Office 365:
-
Search for “Resources” in the manifest.
-
Replace all instances of sisense-logo-x.png with your file name.
-
Check all string constants.
For Microsoft Excel Add-on icon size and layout requirements, see Monostyle icon guidelines or Fresh Style icon guidelines.
Installation and Access
Installing and Distributing
Sisense Analytics for Microsoft Office 365 must be installed manually into your 365 organization using a single *.xml file in order for your end users to access it from Excel. This can be done by the Microsoft Global Admin.
Refer to Deploy add-ins in the Microsoft 365 admin center to determine if your organization can support centralized deployment.
Note:
Do not submit the application to the Microsoft AppSource Catalog.
When deploying Sisense Analytics for Microsoft Teams into your 365 organization, it is highly recommended to use a single version of the application manifest file at a time. Deploying multiple versions with unique IDs will result in multiple add-in buttons on the task ribbon.
When deploying updates to the application manifest file, you must bump the version in order to trigger an update. Uploading the application manifest with a version bump will trigger an update. Application manifest files with the same Version, and same ID will be skipped by Microsoft.
Users Getting Access
Once deployed, you can locate the Sisense Analytics for Office 365 from within Microsoft Excel:
-
Open Excel from your desktop.
-
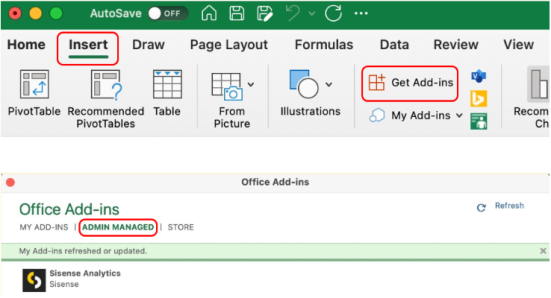
From the task ribbon, select Insert > Get Add-ins.
-
Select the Admin Managed tab in the Office Add-ins window.
-
Double-click the Sisense Analytics add-in.
Once Sisense Analytics for Microsoft Office 365 is available in your task ribbon, you can log in to begin:
-
From the task ribbon, select Home > Sisense Analytics.
-
From the Sisense Infused Analytics task pane on the right, click Login.
-
Provide the email address and password associated with your Sisense account.
-
Click Connect.
All Infusion Apps support Single Sign On (SSO), and will respect the SSO settings/configurations of your instance. Some instances may not require users to provide an email and password if already logged in via SSO. Learn more about Single Sign On here.
Using Sisense Analytics for Microsoft Office 365
Displaying Data Using a View or Bookmark
Views are predefined by the View Creator and Bookmarks are defined by you. All requests will fetch 1000 records at a time, and can be manually stopped at any point. After data is downloaded into Excel, you can interact with it as you would with any other dataset.
Views can be downloaded to multiple worksheets in the workbook. In order to keep Views independent of each other, once a view is downloaded, you cannot 'Add to worksheet' again from the same worksheet. However, you may create a new worksheet and download the same View again.
Users should start by understanding which Views are available to them, in order to know what kinds of questions they can ask. Expanding the Views section, a list of Views and their descriptions will be visible. Taking data directly from a View will return all columns and rows available as defined by the View.
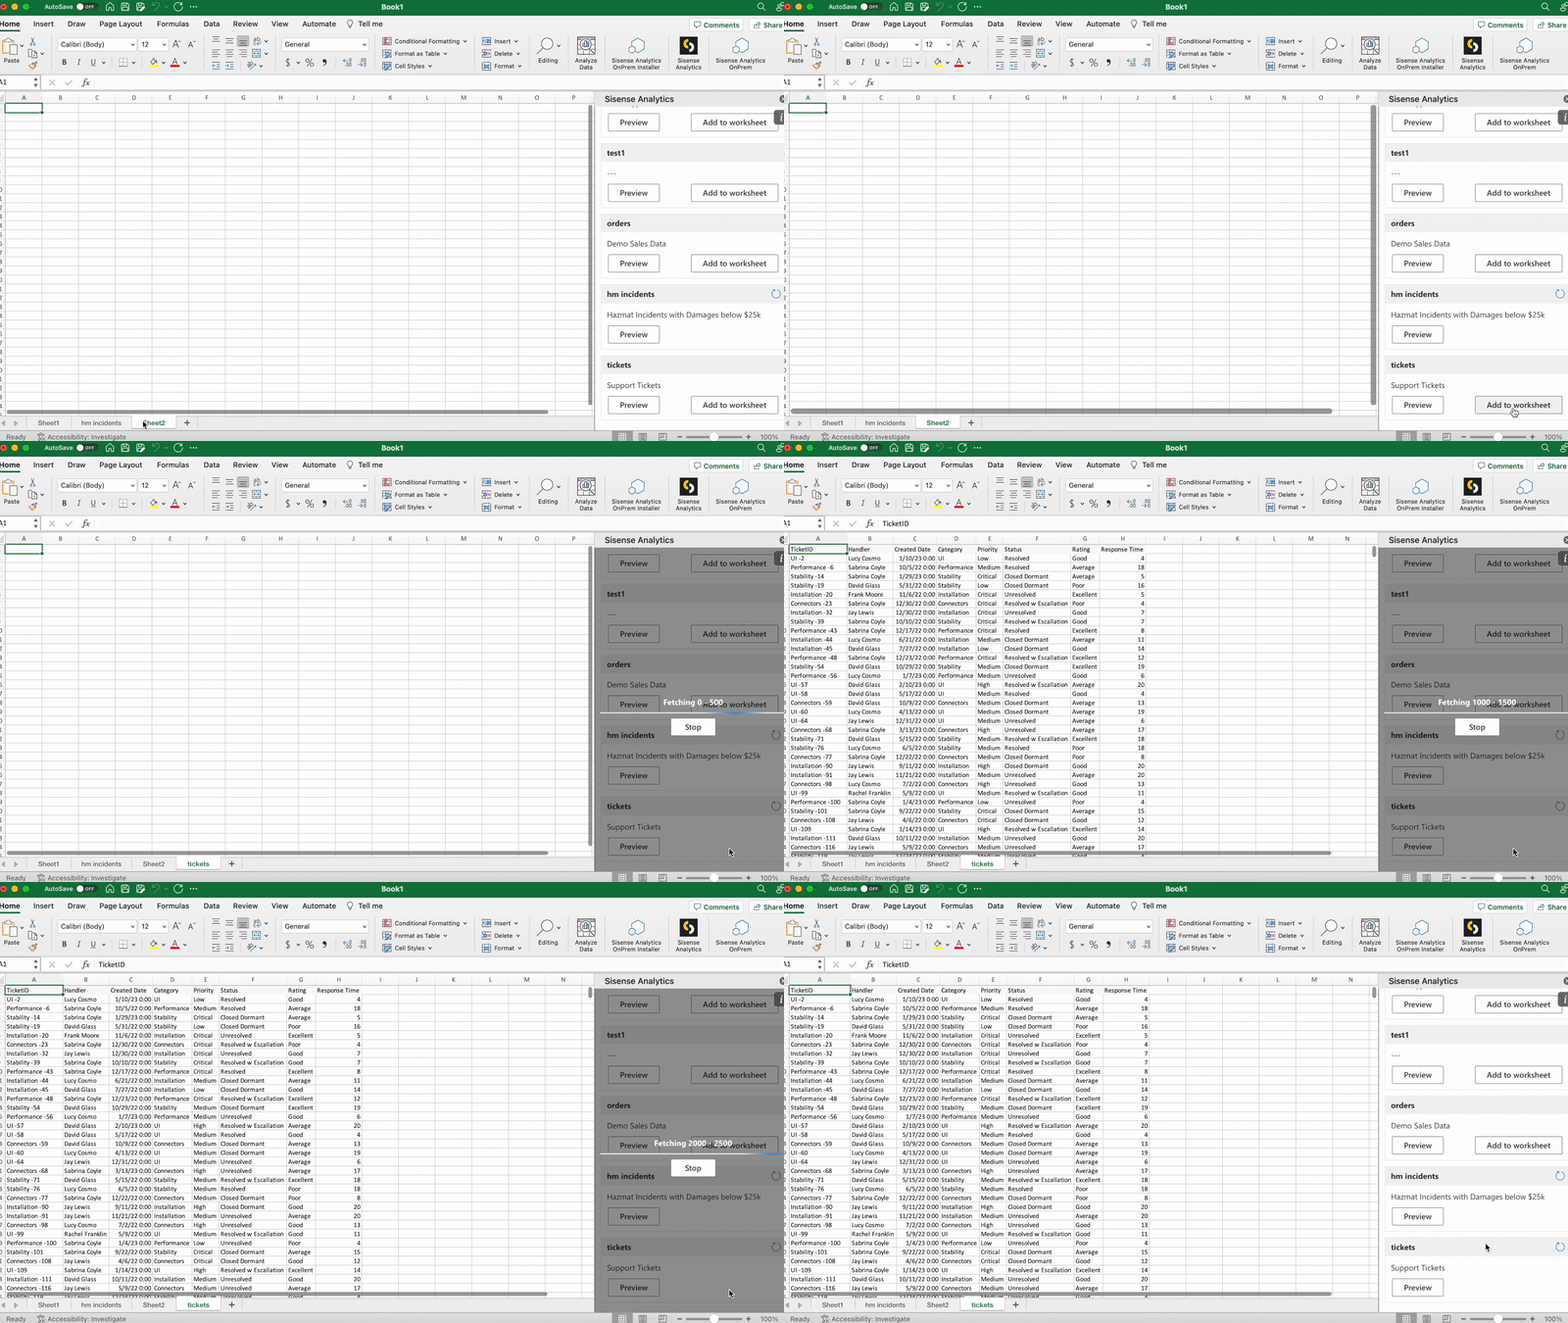
Taking data from a Bookmark will return all columns and rows available as defined by the query in the Bookmark. All your Bookmarks are visible by expanding the Bookmark section in the task pane.
Refreshing Data
In Excel, data can be refreshed as often as you want or need. When refreshed, the previously generated data will be deleted and fully replaced with updated data. You can only refresh the data from a View or Bookmark. You cannot refresh data generated from a query.
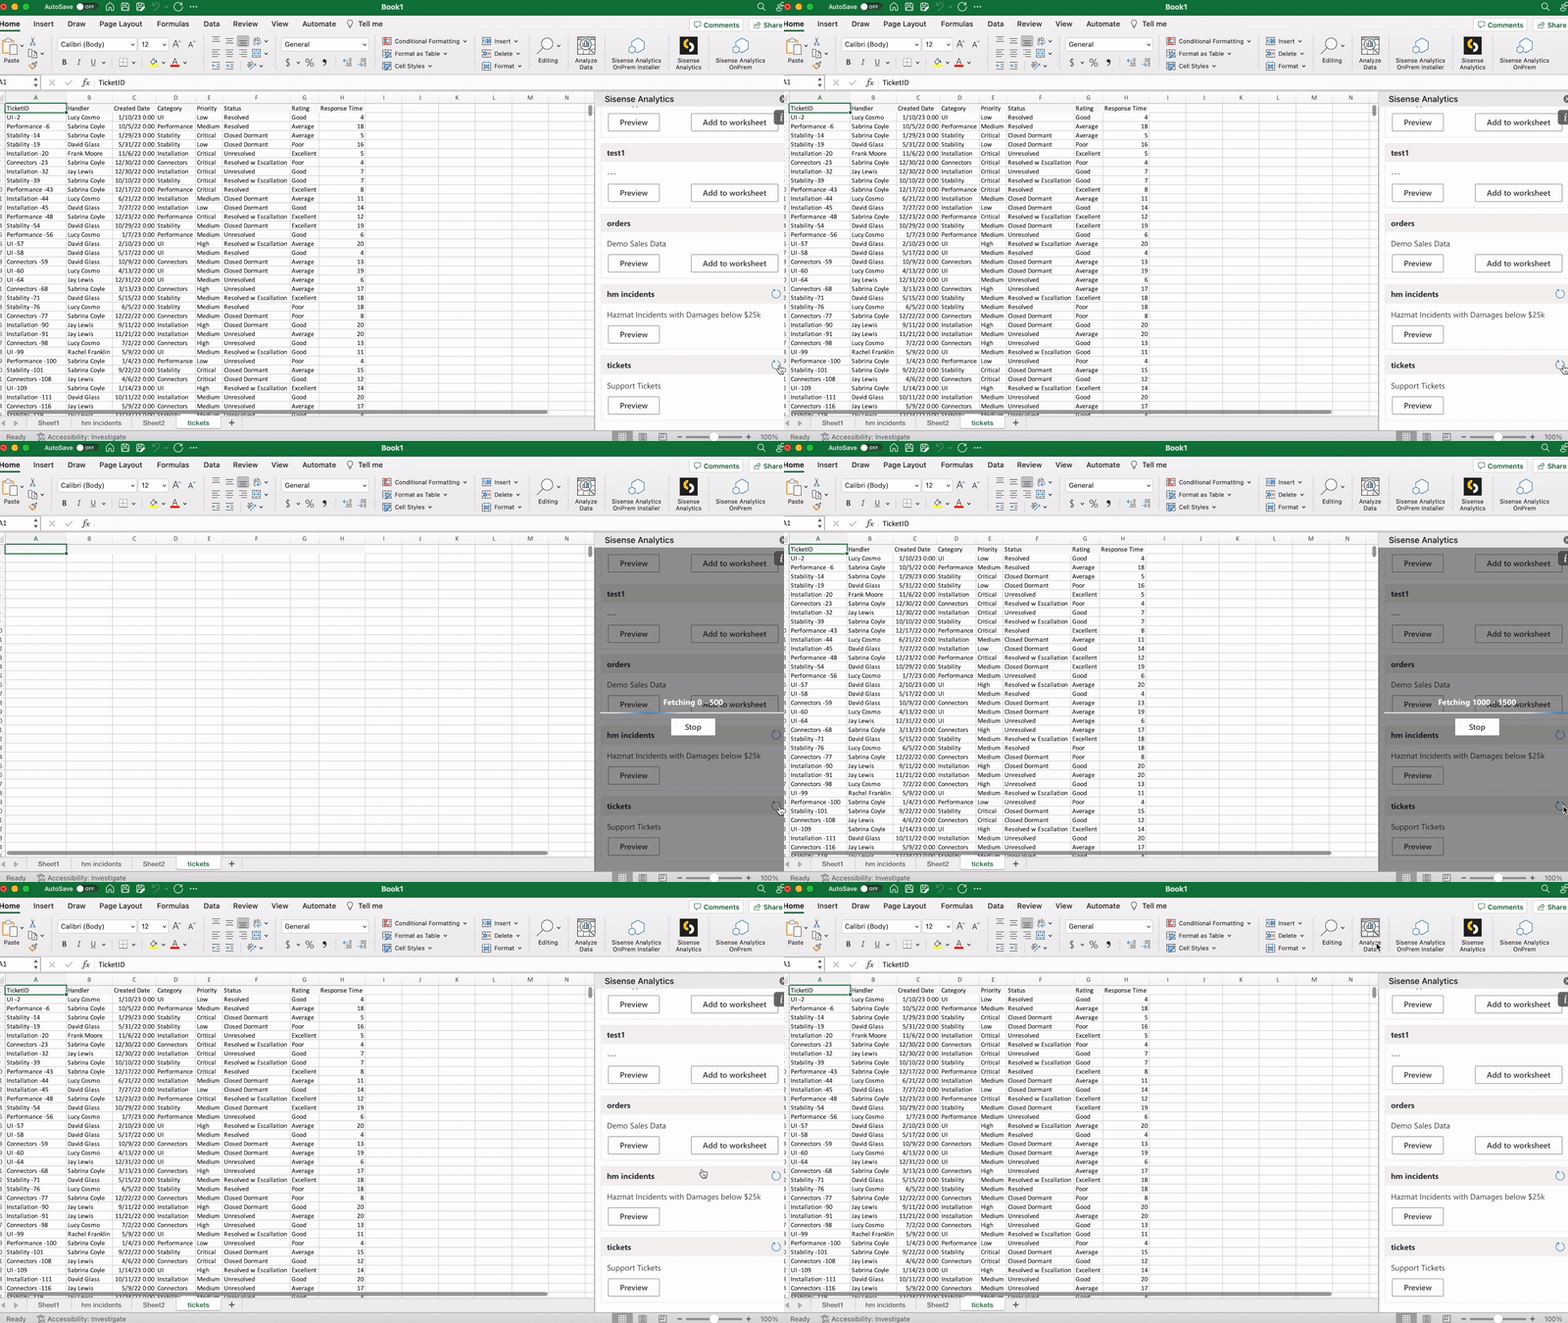
If you make changes to the order or columns, add or remove columns or rows, etc. those changes will be overridden when a refresh is performed. Depending on how you plan to use your data, it is advisable to maintain the raw data in a worksheet, and reference, create pivots or do analysis on a separate worksheet. This way, your analysis is maintained when data is updated.
Data coming from an ElastiCube will refresh based on the build schedule of the cube. Data coming from a Live model will refresh with new data each time the user refreshes.
This means that depending on the build schedule or how often the data in your live model is changing, and how often you are refreshing data, you may not see changes that you expect to see.
If you expect to see changes in data, but are not seeing them, contact your administrator.
Refreshing Data from a Single View or Bookmark
You can refresh the data for a single worksheet. Click the Refresh icon displayed next to the name of the View or Bookmark.
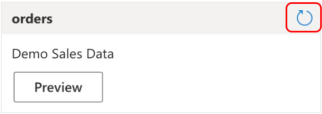
When refreshing a single worksheet, only the selected tab will refresh, regardless of whether you have downloaded the same view to a different tab.
Refreshing Data Across Multiple Views and Bookmarks
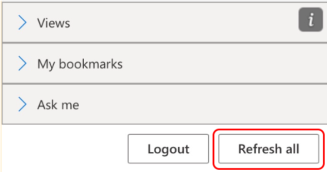
To refresh all data across all worksheets within the workbook, click Refresh All at the bottom of the task pane.
Asking Questions
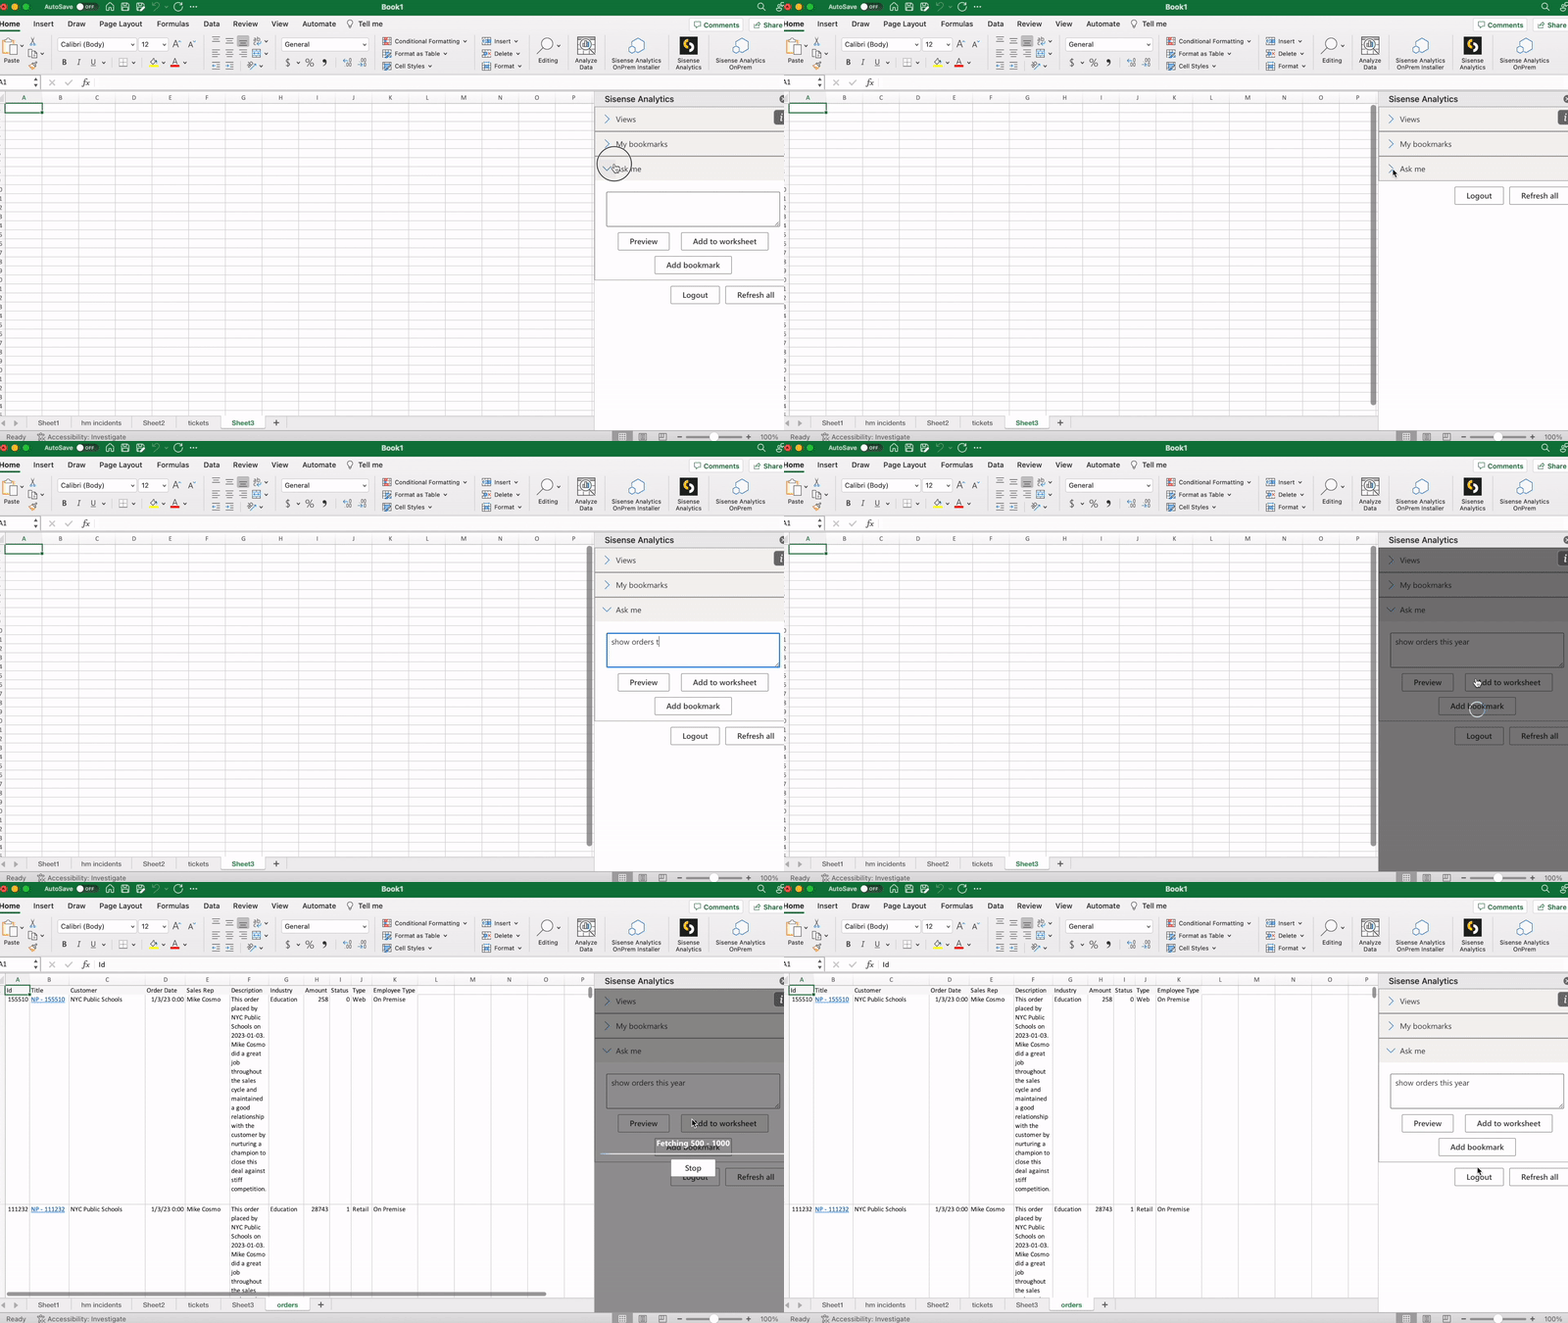
Sisense Analytics for Office 365 uses “Ask Me”, to take natural language questions submitted by a user, query data within Sisense, and return data displaying natively in the application. Ask Me requires that users follow some syntactical rules when asking questions.
Asking questions in Sisense Analytics for Office 365 is best used for refining, or filtering the data in a View or Bookmark, with intention of performing more complex analysis.
In Excel, responses to questions are returned in a raw, tabular format The data displayed in the output corresponds to how the columns are configured within the View.
Saving Questions for Repeated Use
In some cases, users may ask similar, or even the same, questions over and over again.
A query can be saved as a Bookmark and referenced at any time by expanding the Bookmarks section in the task pane. Bookmarks are saved for each user, but questions can be shared and then bookmarked by others.
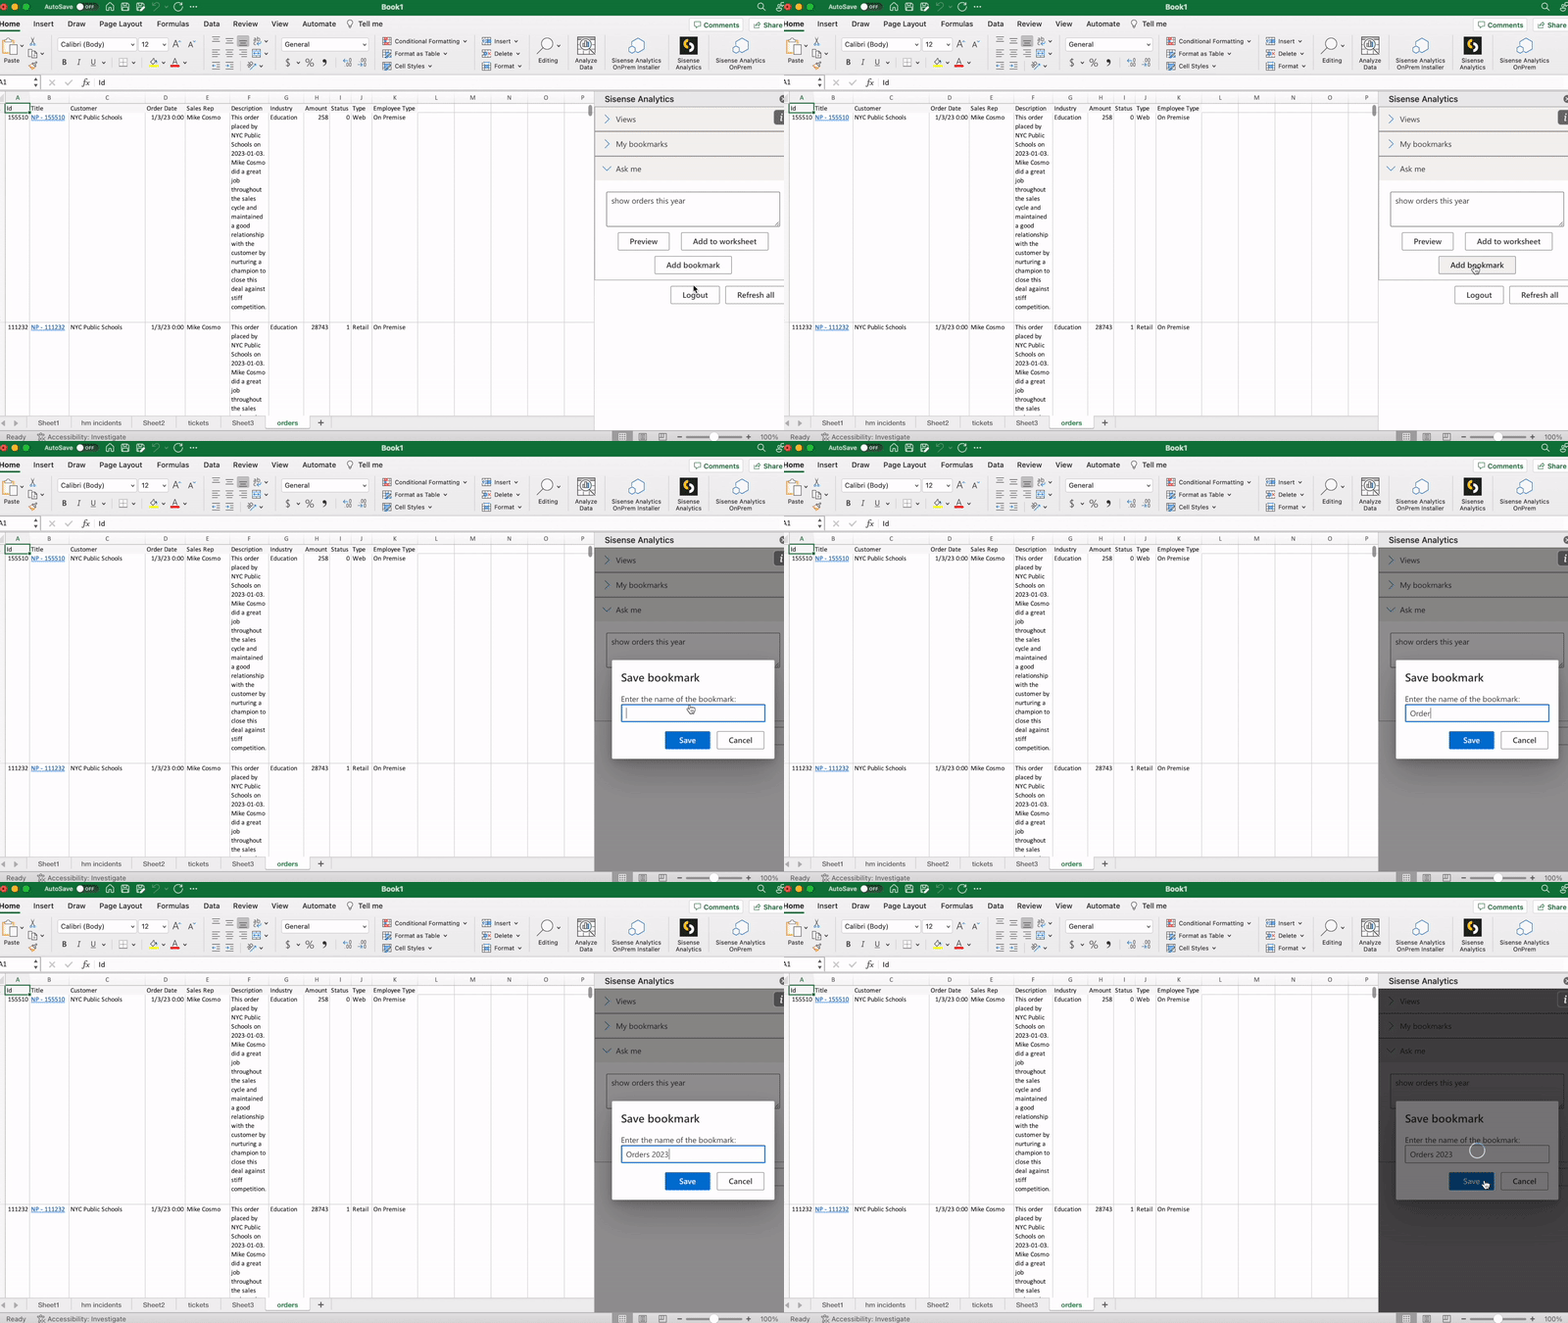
See Using Bookmarks for more information about creating and managing Bookmarks.
Previewing a Dataset
The results of a View, Bookmark or Query can be previewed prior to downloading to a worksheet. The preview will display the first 10 rows, and all the columns. Adding data to a worksheet from the Preview window will download the full data set.
Creating Reusable Presentations
Sisense Analytics for Office 365 allows you to easily create presentations for use over and over again, just by refreshing the data. You can either continue updating the same presentation as needed, or create a new version and maintain the old.
This is particularly helpful with creating slide decks on a cadence with the same set of data, but in the relevant time range (i.e. Quarterly Business Reviews, etc.). You can then use the Refresh function to automatically update all of the charts on the slide deck with one click.
Linking Charts from Excel to Powerpoint
You can leverage Microsoft Office 365's native capability of linking to Excel charts from PowerPoint slides and use the Refresh feature to easily update data across all charts in your presentation decks.
Note:
Chart linking can only be done on the Desktop version of Excel for Office 365. This limitation is controlled by Microsoft.
To keep the old presentation, and create a new one that will be able to be refreshed with the latest data, perform the standard steps of File > Save As. Because your Excel workbook stands alone, and is the source of the charts, a copy is not required.
Ensuring Data Series Compatibility
Excel charts are based on a series of data. When Views or Bookmarks are refreshed, they may not have the same amount of data - either more than the selected data series or less, which will create null data points.
You can either:
-
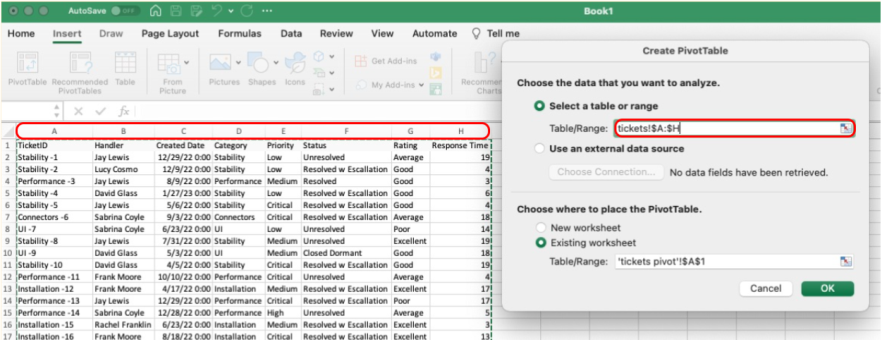
Create pivot tables that reference the entirety of the columns.
-
Adjust your data series when you perform your refresh, which will automatically update the linked chart.
-
Use formulas and macros to create a static data series that is referenced by the source data. This way, the data series will always stay the same.
