Sisense Analytics for Google Workspace
Setup and Configuration
Infusion Apps and Sisense Analytics for Google Workspace must be enabled on that instance. Refer to Enabling Infusion Apps before starting.
Roles & Responsibilities
To complete setup and configuration, you will need a:
-
Google Workspace Admin to grant or remove access to apps across a workspace
Review the documentation to ensure that you understand who within your organization is required to be involved.
Installation and Access
Installing and Distributing
Sisense Analytics for Google Workspace is managed and distributed by Sisense through the Google Workspace Directory.
Sisense cannot currently offer this Infusion App as a white labeled option.
Users Getting Access
Google users can add Sisense Analytics for Google to their individual accounts.
-
In the menu, click Extensions > Add-ons > Get add-ons.
-
Search for Sisense Analytics or Infused Analytics.
-
Click the Sisense Analytics or Infused Analytics tile.
-
Click Accept on the permission scope.
Once Sisense Analytics for Google is available in your extensions menu, you can log in to begin. You can log in to both Google Sheets and Google Slides from either add-on. You do not need to log in to them separately.
-
Click Extensions > Sisense Analytics > Analyze Data.
-
In the Sisense Infused Analytics task pane on the right, enter the Sisense URL.
-
Click Login.
-
Provide the email address and password associated with your Sisense account.
-
Click Connect.
All Infusion Apps support Single Sign On (SSO), and will respect the SSO settings/configurations of your instance. Some instances may not require users to provide an email and password if already logged in via SSO. Learn more about Single Sign On here.
Using Sisense Analytics for Google Sheets
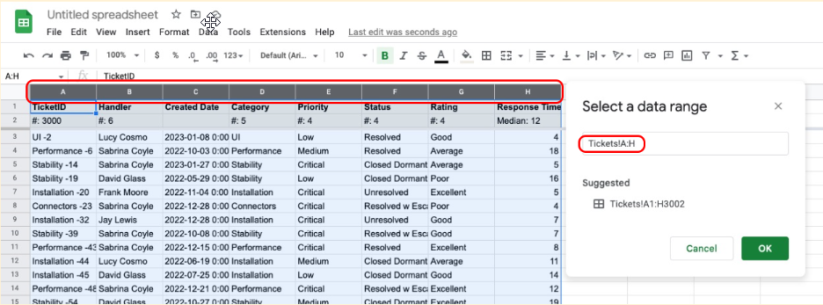
Displaying Data Using a View or Bookmark
Views are predefined by the View Creator and Bookmarks are defined by you. All requests will fetch 1000 records at a time, and can be manually stopped at any point. After data is downloaded into Google Sheets, you can interact with it as you would with any other dataset.
Views can be downloaded to multiple worksheets in the workbook. In order to keep Views independent of each other, once a view is downloaded, you cannot 'Add to worksheet' again from the same worksheet. However, you may create a new worksheet and download the same View again.
Users should start by understanding which Views are available to them, in order to know what kinds of questions they can ask. Expanding the Views section, a list of Views and their descriptions will be visible. Taking data directly from a View will return all columns and rows available as defined by the View.
Taking data from a Bookmark will return all columns and rows available as defined by the query in the Bookmark. All your Bookmarks are visible by expanding the Bookmark section in the task pane.
Refreshing Data
In Google Sheets, data can be refreshed as often as you choose. When refreshed, the previously generated data will be deleted and fully replaced with updated data. You can only refresh the data from a View or Bookmark. You cannot refresh data generated from a query.
If you make changes to the order or columns, add or remove columns or rows, etc. those changes will be overridden when a refresh is performed. Depending on how you plan to use your data, it is advisable to maintain the raw data in a sheet, and reference, create pivots or do analysis on a separate sheet. This way, your analysis is maintained when data is updated.
Data coming from an ElastiCube will refresh based on the build schedule of the cube. Data coming from a Live model will refresh with new data each time the user refreshes.
This means that depending on the build schedule or how often the data in your live model is changing, and how often you are refreshing data, you may not see changes that you expect to see.
Refreshing Data from a Single View or Bookmark
You can refresh the data for a single worksheet. Click the Refresh icon displayed next to the name of the View or Bookmark.
When refreshing a single worksheet, only the selected tab will refresh, regardless of whether you have downloaded the same view to a different tab.
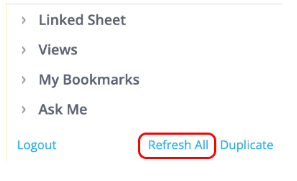
Refreshing Data Across Multiple Views and Bookmarks
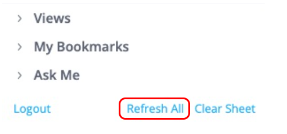
To refresh all data across all worksheets within the workbook, click Refresh All at the bottom of the task pane.
Asking Questions
Sisense Analytics for Google Sheets uses “Ask Me”, to take natural language questions submitted by a user, query data within Sisense, and return data displaying natively in the application. Ask Me requires that users follow some syntactical rules when asking questions.
Asking questions in Sisense Analytics for Google Sheets is best used for refining, or filtering the data in a View or Bookmark, with intention of performing more complex analysis.
In Google Sheets, responses to questions are returned in a raw, tabular format. The data displayed in the output corresponds to how the columns are configured within the View.
Saving Questions for Repeated Use
In some cases, users may ask similar, or even the same, questions over and over again.
A query can be saved as a Bookmark and referenced at any time by expanding the Bookmarks section in the task pane. Bookmarks are saved for each user, but questions can be shared and then bookmarked by others.
See Using Bookmarks for more information about creating and managing Bookmarks.
Previewing a Dataset
The results of a View, Bookmark or Query can be previewed prior to downloading to a sheet. The preview will display the first 10 rows, and all the columns. Adding data to a sheet from the Preview window will download the full data set.
Using Sisense Analytics for Google Slides
Creating a Visualization Using a View, Bookmark, or Query
Sisense Analytics for Google Slides enables you to create three visualization types from within the task pane: chart, table, or summary. These visualizations can be generated from a View, Bookmark, or Query as needed. After creation in Google Slides, you can interact with it as you would with any other data set.
Users should start by understanding which Views and Bookmarks are available to them. Expanding the Views section will display the Views and their descriptions will be visible. All of your Bookmarks are visible by expanding the Bookmark section in the task pane.
Linked Sheets
For each new presentation launched in Sides, a dedicated, corresponding Google sheet is created.
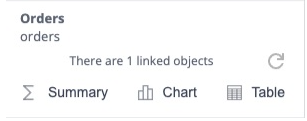
Each time a chart or table visualization is created a new tab with the name of the chart title appears on the corresponding sheet. A “linked object” indicator displays under the specific View or Bookmark, indicating how many charts or tables have been created using that View or Bookmark.
The linked sheet can be found by:
-
Expanding the Linked Sheet section
-
Clicking the link button and selecting Open Source
Note: When you delete charts and other linked components from the slide deck, you can choose to clean up the corresponding data in the Google spreadsheet.
It is recommended that you name the spreadsheet with the same name as your slide deck so as to not lose, or accidentally delete, the corresponding sheet with the data that the charts and tables refer to.
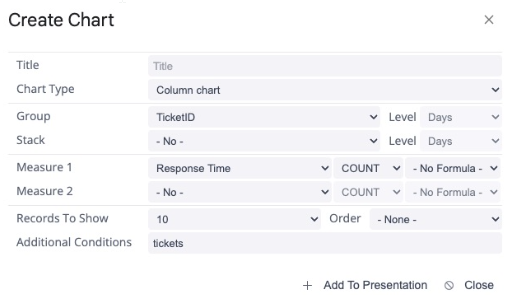
Creating a Chart using the Chart Editor
A chart can be generated using the Chart Editor. Use the editor to specify the display options for your chart. The chart options are dynamic and may be visible or not depending on which chart type is selected.
| Field | Description |
| Title | The title or description of your chart. The chart title will also be the name of the auto-generated tab in the Linked Sheets. |
| Chart Type |
A list of the supported chart types:
|
| Group | Dimension that displays on the X-axis of your chart (if applicable). Use the plus sign ("+") to add additional groups as needed. |
| Stack | Sub-group by which the chart is stacked (if applicable). |
| Measure | Measure field and its aggregation. A measure is a field that contains quantitative values that you can measure like numeric data. Use the plus sign ("+") to add additional measures as needed. |
| Formula | An optional date formula. Optional date formula that maps to the standard Quick Functions > Change over Time formulas in Sisense. |
| Records to Show | The number of records displayed as part of the chart. If visualizing a dimension with a large number of unique values, it is recommended to limit the records. |
| Additional Conditions | Displays the View or Bookmark query upon which the data used to create the chart is based. You may augment the query using the Ask Me syntax to add additional filters as needed. |
Creating a Chart Using Raw Data
A chart can also be generated directly from Sheets. This may be a good option if you have already done advanced analysis on data in Sheets, or if you want to display data in a chart type that is not supported by the Chart Editor.
To do this, create a chart in Sheets and link the chart to Slides. See Ensuring Data Series Compatibility for more information.
Note: Creating a chart from raw data does not generate a Linked Sheets.
Creating a Table
A table can be generated using the Table Editor. Use the editor to specify the display options for your table.
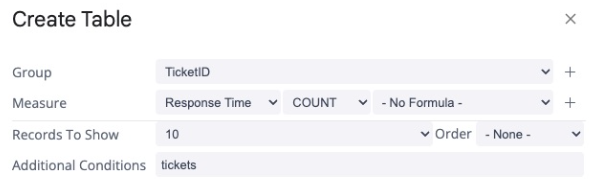
| Field | Description |
| Group | Dimension that displays on the X-axis of your chart. Use the plus sign ("+") to add additional groups as needed. |
| Measure | Measure field and its aggregation. Use the plus sign ("+") to add additional measures as needed. |
| Formula |
Applies a change-over-time formula:
These are similar to the Quick Functions > Change over Time formulas in Sisense dashboards. |
| Records to Show | The number of records displayed as part of the chart. If visualizing a dimension with a large number of unique values, it is recommended to limit the records. |
| Additional Conditions | Displays the View or Bookmark query upon which the data used to create the chart is based. You may augment the query using the Ask Me syntax to add additional filters as needed. |
Creating a Summary
A summary or aggregation can be generated using the Summary button. The summary is generated based on the configuration of the View. You may need to edit the content to best fit your insight and audience.
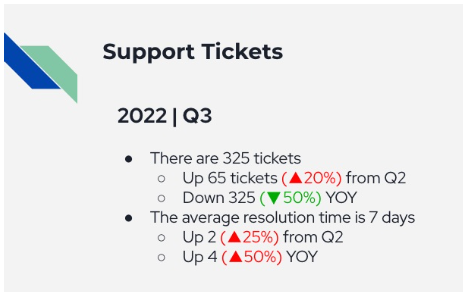
| Bullet # | Field | Description |
| First |
Unique Identifier |
If the query has a date filter, the summary will also include a differential analysis between the Previous Period and The Same Period the Previous Year. |
| Second |
Default Measure |
|
| Subsequent |
Other Measures |
All other measures defined in the view aggregates based on the specified aggregation function. |
Editing Visualizations
You cannot re-launch the Chart Editor for visualization that is already created. In this case, you must use the Google Workspace native editing options to do so.
-
Click the link icon in the top-right corner of the chart or table.
-
Click Open source.
-
When you see the editor and source Sheet:
-
Navigate to the tab for the chart or table being edited.
-
Edit the chart using Google Workspace native editing options.
-
-
Return to the original chart or table in Slides.
-
Click Update.
Note: The Summary visualization can be edited in each slide, but does not generate a Linked Sheet.
Refreshing Data
In Google Slides, data can be refreshed as often as you want or need. When refreshed, the previously generated visualizations will be deleted and fully replaced with an updated version. You can only refresh visualizations from a View or Bookmark. You cannot refresh visualizations generated from a query.
Data coming from an Elasticube will refresh based on the build schedule of the cube. Data coming from a Live model will refresh based on….
This means that depending on the build schedule, and how often you are refreshing data, you may not see changes that you expect to see.
Refreshing Visualizations
In Google Slides, data can be refreshed as often as you choose. When refreshed, the previously generated visualizations will be deleted and fully replaced with updated versions. You can only refresh visualizations from a View or Bookmark. You cannot refresh visualizations generated from a query.
If you make changes to the order or columns, add or remove columns or rows, etc. those changes will be overridden when a refresh is performed. Depending on how you plan to use your data, it is advisable to maintain the raw data in a sheet, and reference, create pivots or do analysis on a separate sheet. This way, your analysis is maintained when data is updated.
Data coming from an ElastiCube will refresh based on the build schedule of the cube. Data coming from a Live model will refresh with new data each time the user refreshes.
This means that depending on the build schedule or how often the data in your live model is changing, and how often you are refreshing data, you may not see changes that you expect to see.
Refreshing Visualizations from a Single View or Bookmark
You can refresh the data for a single visualization. Click the Refresh icon displayed next to the name of the View or Bookmark.
Refreshing Data Across Multiple Views and Bookmarks
To refresh all visualizations across all worksheets within the workbook, click Refresh All at the bottom of the task pane.
Refreshing Charts with Raw Data
If any charts are generated using raw data, to update the charts, a refresh must be performed on the source in Google Sheets to ensure the source data is also being refreshed.
Asking Questions
Sisense Analytics for Google Slides uses “Ask Me”, to take natural language questions submitted by a user, query data within Sisense, and return data displaying natively in the application. Ask Me requires that users follow some syntactical rules when asking questions.
Asking questions in Sisense Analytics for Google Slides is best used for creating more specific visualizations, as needed.
In Google Slides, responses to questions are returned in either a table, chart or summary as indicated by the user.
Creating Reusable Presentations
Sisense Analytics for Google Slides enables you to easily create presentations for use over and over again, just by refreshing the data. You can either continue updating the same presentation as needed, or create a new version and maintain the old.
This is particularly helpful with creating slide decks on a cadence with the same set of data, but in the relevant time range (i.e. Quarterly Business Reviews, etc.). You can then use the Refresh function to automatically update all of the charts on the slide deck with one click.
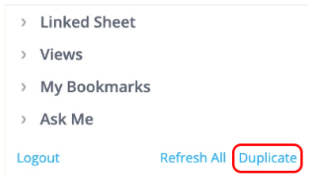
To keep the old presentation, and create a new one that will be able to be refreshed with the latest data, click the Duplicate link at the bottom of the task pane.
Duplicating a presentation creates a new version of the file. This also creates a new version of the linked sheets. This is important because the linked sheet is what allows the data to be refreshed using the refresh function.
If you are duplicating a new document for the first time, you will be prompted to define a location for all linked sheets to be stored. After that, you can move the file into a specific folder.
If you are duplicating an already duplicated presentation, the linked sheets will be created in the previously specified folder. Again, after which, you can move the file into a specific folder.
Note: Using the Google native 'Make a copy' function only copies the slide deck, not the corresponding spreadsheet and will not enable you to refresh data.
Ensuring Data Series Compatibility
Google charts and tables are based on a series of data. When Views or Bookmarks are refreshed, they may not have the same amount of data - either more than the selected data series or less, which will create null data points.
You can either:
-
Create pivot tables that reference the entirety of the columns
-
Adjust your data series when you perform your refresh, which will automatically update the linked chart.
-
Use formulas and macros to create a static data series that is referenced by the source data. This way, the data series will always stay the same.