Monitoring Sisense on Linux
Previous Step
Sisense comes with several tools for monitoring the health of your Sisense deployment that allow you to troubleshoot any issues. These tools allow you to monitor the following areas:
- Dashboard performance build times
- Sisense cluster status
- Sisense containers in your Kubernetes namespace
Monitoring Query and Build
To monitor processes such as query and build, use Usage Analytics.
System Management
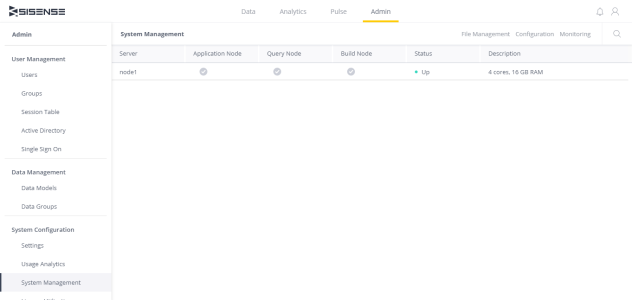
In the Admin page of Sisense, you can view the health of your nodes from the System Management tab.
Within the System Management tab, you can view which nodes are active, the status of your system, and a description of the system's hardware specifications.

Application Health Check
You can monitor the Sisense deployment using third-party tools to check its CPU and RAM usage, hard-disk health, and so on. However, what if the Sisense instance is functioning properly, but your dashboards do not load? Third-party applications cannot monitor Sisense -specific services and aren't useful for tracking down the cause of these issues. To fill this gap, Sisense provides Application Health Check, an API to help you easily see if the Sisense queue is full, if your queries are processing properly, if your dashboards are loading, and so on.
There are several individual tests that you can perform with the Application Health Check API on your Sisense deployment. You can run all of the tests at once, or select the one(s) you want to run. The API performs tests that checks the health of the following in Sisense :
- Dashboard loading and rendering services
- ElastiCube building services
- Reporting services
- Infrastructure services
- Logging services
- Rate limiting services
To use this feature, you'll need to set up certain parameters for these tests. For example, for the test that evaluates the health of a specific ElastiCube , use the API to set the name(s) of the ElastiCubes to monitor.
You can also specify the inline test configurations instead of using the global preset tests. This enables you to configure health monitoring tests for ad-hoc use.
For technical API information about Application Health Check, see developer.sisense.com.
You can also run system monitoring tests via the REST API or a Command Line Interface (CLI). For more information, see Monitoring Sisense with APIs and CLI.
Grafana
Sisense provides a Grafana dashboard on Prometheus for monitoring your Sisense Linux cluster. This dashboard allows you to track performance and usage of different pods across different namespaces, investigate performance issues from a centralized location.
Note:
Grafana has announced that in future versions AngularJS will not be supported. Learn more here: https://grafana.com/blog/2024/03/11/removal-of-angularjs-support-in-grafana-what-you-need-to-know/
This is purely informational about a future change, and does not mean that dashboards which depend on Angular will not be functional.
In the future, once Grafana is upgraded to the relevant version, Sisense will ensure that all Grafana dashboards that are shipped with the product will continue to work as expected.
If you have created any custom dashboards, follow Grafana's recommendations about how to remove AngularJS from your custom dashboards.
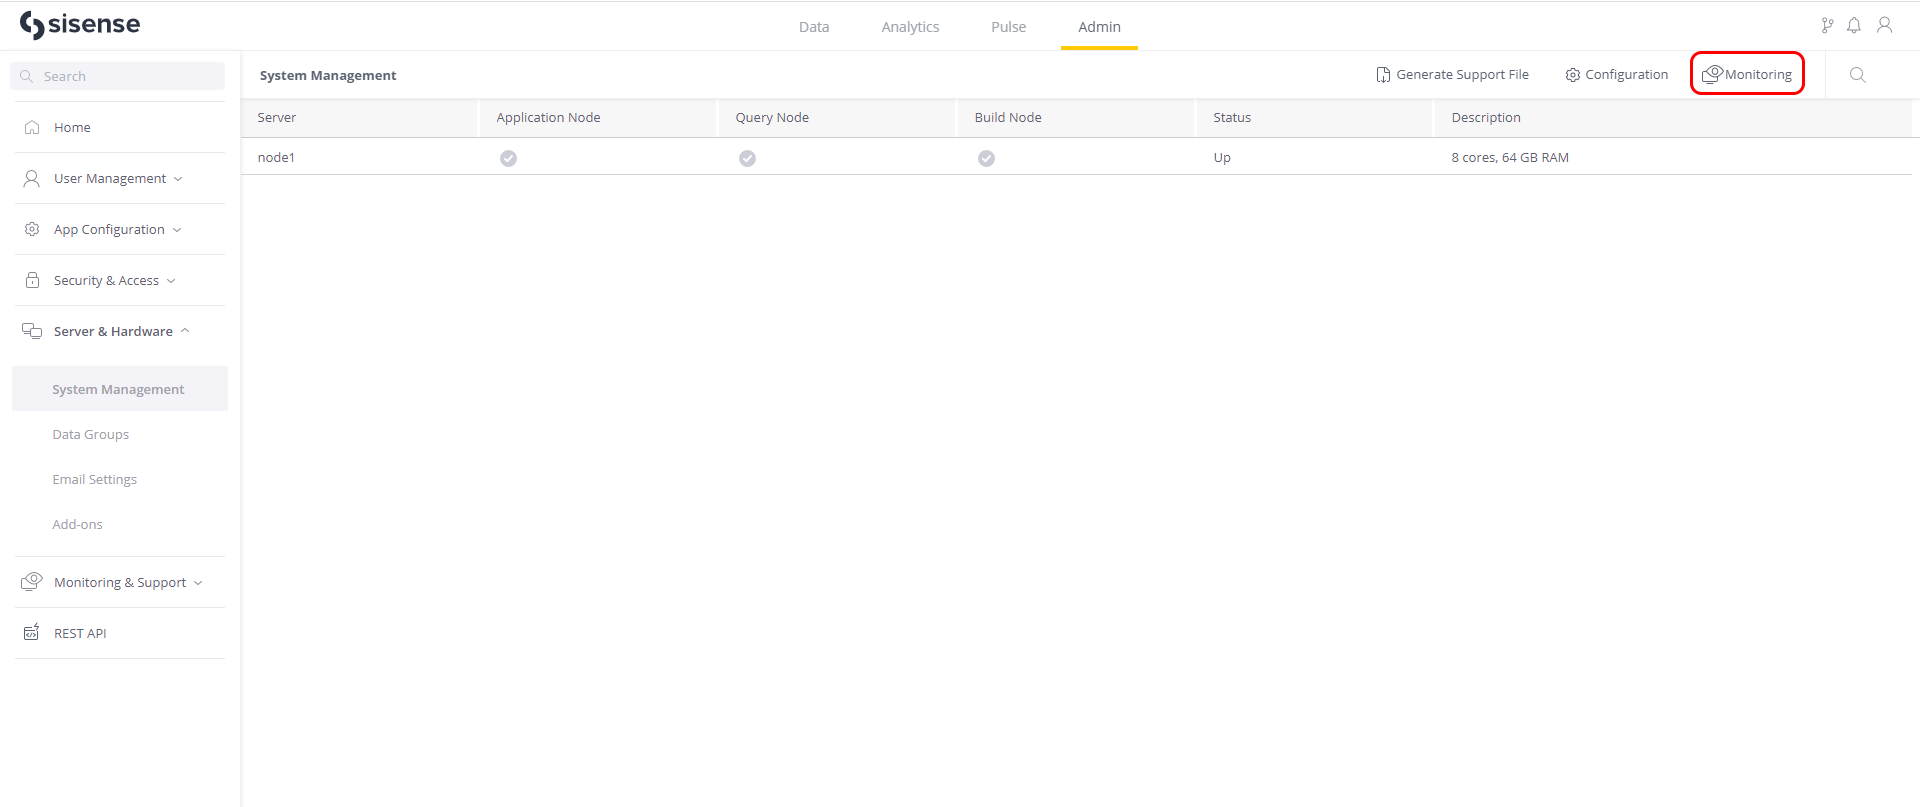
You can access your Grafana from the System Management tab, by clicking Monitoring:

OR
In your browser, type http://{IP}:(random _port*)/login
You can retrieve the port with the following command: kubectl get svc -n monitoring prom-operator-grafana
If you have set a base URL in a Linux environment that is accessed through SSH, you cannot access Grafana through the Admin page until you update the URL of Grafana in your Linux CLI with the following command:
kubectl -n sisense set env deploy/grafana-sisense GF_SERVER_ROOT_URL=< Enter Your URL Here >/app/grafana
If you want to customize Grafna's port, you can modify it in the default.yaml configuration file location in "sisense version number"/installer/default.yaml.
In this file, the value of grafana_port is 30300. You can modify this value to customize the port.
Kubernetes Dashboard
The Kubernetes Dashboard provides an interface for troubleshooting Sisense containers, and manage the cluster's resources. You can use the dashboard to get an overview of how Sisense is running on your cluster as well as monitoring Sisense resources.
To access your Sisense Kubernetes dashboard, enter the following URLs into your browser:
Single Node Deployments
https://{IP}:6443/api/v1/namespaces/kube-system/services/https:kubernetes-dashboard:/proxy
Multi-Node Deployments
https://{IP}:6443/api/v1/namespaces/kube-system/services/https:kubernetes-dashboard:/proxy
Note:
Replace {IP} with the IP address you defined in the config.yaml file when you provisioned Sisense.