Assistant
Last updated: June 11, 2026
| Tier | Deployment |
|
|
|
Note:
See Generative AI (Cloud-Linked Features) - Empowering Your Analytics Experience for additional setup details.
The assistant is an AI-first interface for end-to-end analytics creation, from data acquisition to data modeling, insights generation, and embedding. The assistant is also a conversational interface available directly within Sisense dashboards, designed to empower users with self-service analytics through natural language interaction. The assistant is available for managed cloud customers, as well as self-hosted customers (as long as the prerequisites are met). It supports data designers, dashboard designers, and end users in quickly creating analytics, gaining insights, exploring data, and building visualizations directly within the dashboard environment. This feature will ultimately replace our more traditional natural language query feature, Simply Ask, offering a modern, intuitive experience aligned with the expectations of today’s data consumers. By simplifying analytics and widget creation and exploration, the assistant addresses core usability and productivity challenges faced by data designers, dashboard designers, and data viewers.
Depending on where you are in the workflow, the assistant appears in different contexts with tailored capabilities:
-
Studio Assistant: Available in a dedicated tab, designed for creators working across the full analytics lifecycle: from data modeling, to chart and dashboard creation, to embedding.
-
Analytics Assistant: Available in the Analytics tab (dashboards). This experience supports dashboard owners, enabling them to create new dashboards, add or edit charts, and explore data. The assistant is also available in embedded dashboards via iFrame embedding, extending its capabilities to shared users.
Use Cases and Benefits
Use Cases
-
Data Designers can create analytics, from data acquisition to data modeling, generate insights, and embed.
-
Dashboard Owners always have access to the assistant and can use it to create widgets on new or existing dashboards via chat.
-
Users with Design Permissions: Any user the dashboard is shared with who has design permissions can also create and add widgets through the assistant.
-
Viewers can use the assistant to ask questions and generate insights in a conversational manner, including asking the assistant to create widgets based on the data model shared with them. They can explore the data model via the assistant but cannot add widgets to an existing dashboard nor modify dashboard content.
Benefits
The assistant democratizes access to data by allowing users to interact with dashboards through natural language, reducing reliance on technical teams for generating insights. It accelerates dashboard design and iteration, making it easier for designers to create and refine content in real-time. The assistant supports both open-ended data exploration, where users ask spontaneous questions, and more structured, guided analysis, helping users uncover insights in ways that traditional dashboards alone cannot.
Supported LLMs
Before you can enable the assistant, you must first configure and deploy an LLM provider, such as OpenAI or Azure OpenAI Service. See Setting Up Your LLM for instructions.
Enabling the Assistant
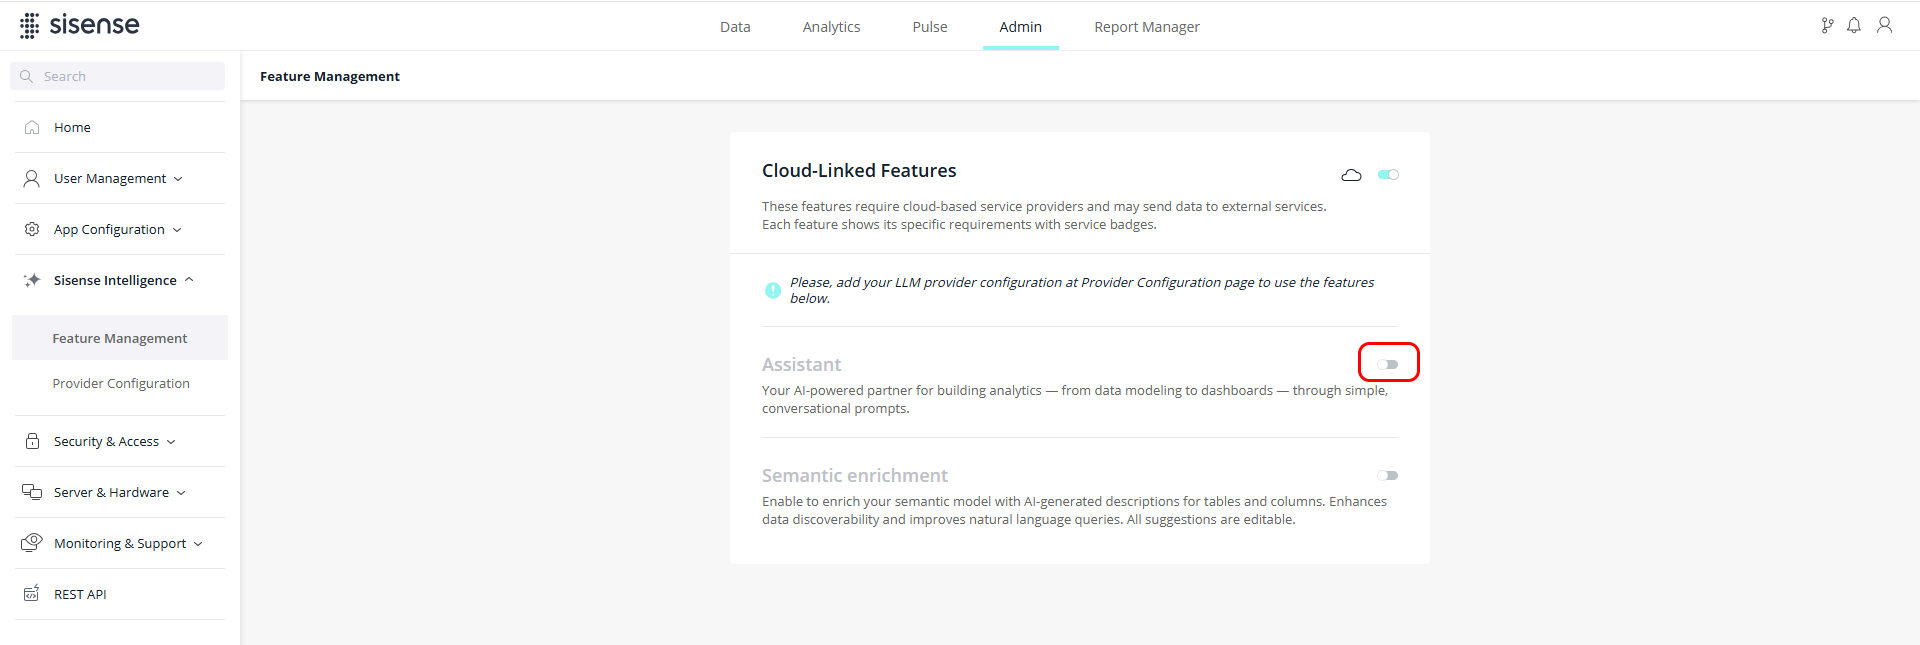
In order to use the assistant, it must be enabled by an Admin, in the Admin tab, under Sisense Intelligence > Feature Management. This makes the assistant available to all dashboard owners across the environment.
Once enabled globally, dashboard owners must then activate the assistant individually for each dashboard for which they want it to be available to users. When enabled, dashboard owners will see the assistant button ![]() appear in the dashboard toolbar. This ensures dashboard owners maintain control over which dashboards provide conversational access to their data. In the Analytics tab, for the relevant dashboard, click
appear in the dashboard toolbar. This ensures dashboard owners maintain control over which dashboards provide conversational access to their data. In the Analytics tab, for the relevant dashboard, click  > Share the assistant to share the assistant with others. A confirmation dialog explains the impact and ensures viewers only get access when intended.
Note:
The "Share the assistant" toggle is not presented in Co-Authoring mode when the dashboard has not yet been shared.
After it is enabled, the assistant button appears in the dashboard menu.

For more information about enabling Generative AI and setting up LLM access, refer to the Enabling Generative AI and Setting Up Your LLM documentation.
Optional Enhancements
While the following enhancements are optional, they are recommended, as a clean, structured model provides better clarity and improves the quality of insights. See Optimizing Your Data Model for AI for more information.
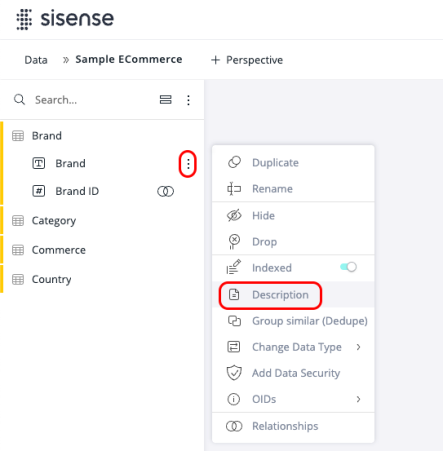
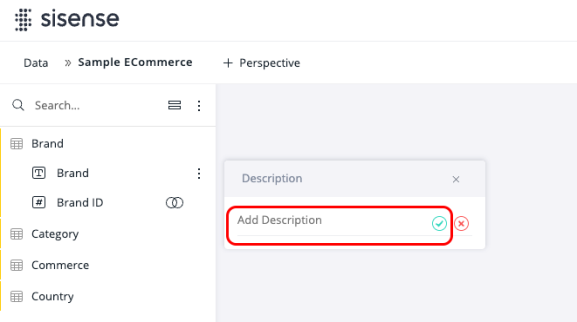
The more the data model is concise and relevant, the better for assistant usage. If there are many columns that are not being used / have duplicates by names, it might cause confusion for the LLM to select the correct columns for queries and insights, which will cause low quality performance. It is recommended that you use perspectives and select only the relevant tables/columns that are to be used, and review their names - as they are not confusing and semantically relevant for their usage (that is, column name " ABC" does not have semantic meaning). Additional ways to improve semantic understanding are column and table descriptions. If available, they are used by the assistant to better understand the column and table meanings and how to use them to generate queries and provide insights. Descriptions are used as hints to the LLM for better understanding column usage/values and when to use them.
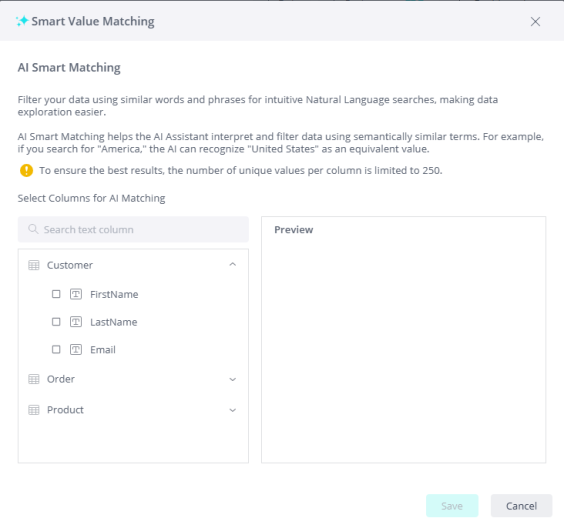
Smart Value Matching improves the assistant’s ability to interpret natural language questions that involve filtering or referencing specific values - especially when users do not know the exact terms used in the dataset. It enables the assistant to match informal, shorthand, or synonymous input to column values based on semantic similarity.
For example, a user might ask to "filter by northeast" and the assistant could correctly match that to a value labeled "NE Region", even though the user did not use that exact phrase.
Smart Matching is supported only for text columns with up to 250 distinct values. It is ideal for fields such as product names, customer segments, or geographic regions.
Note:
Model statistics work across all connectors. After a build, it may take a few minutes for the statistics to be collected.
To enable Smart Value Matching on a column:
-
Open the Data tab.
-
Open your data model.
-
Click
 > Smart Value Matching.
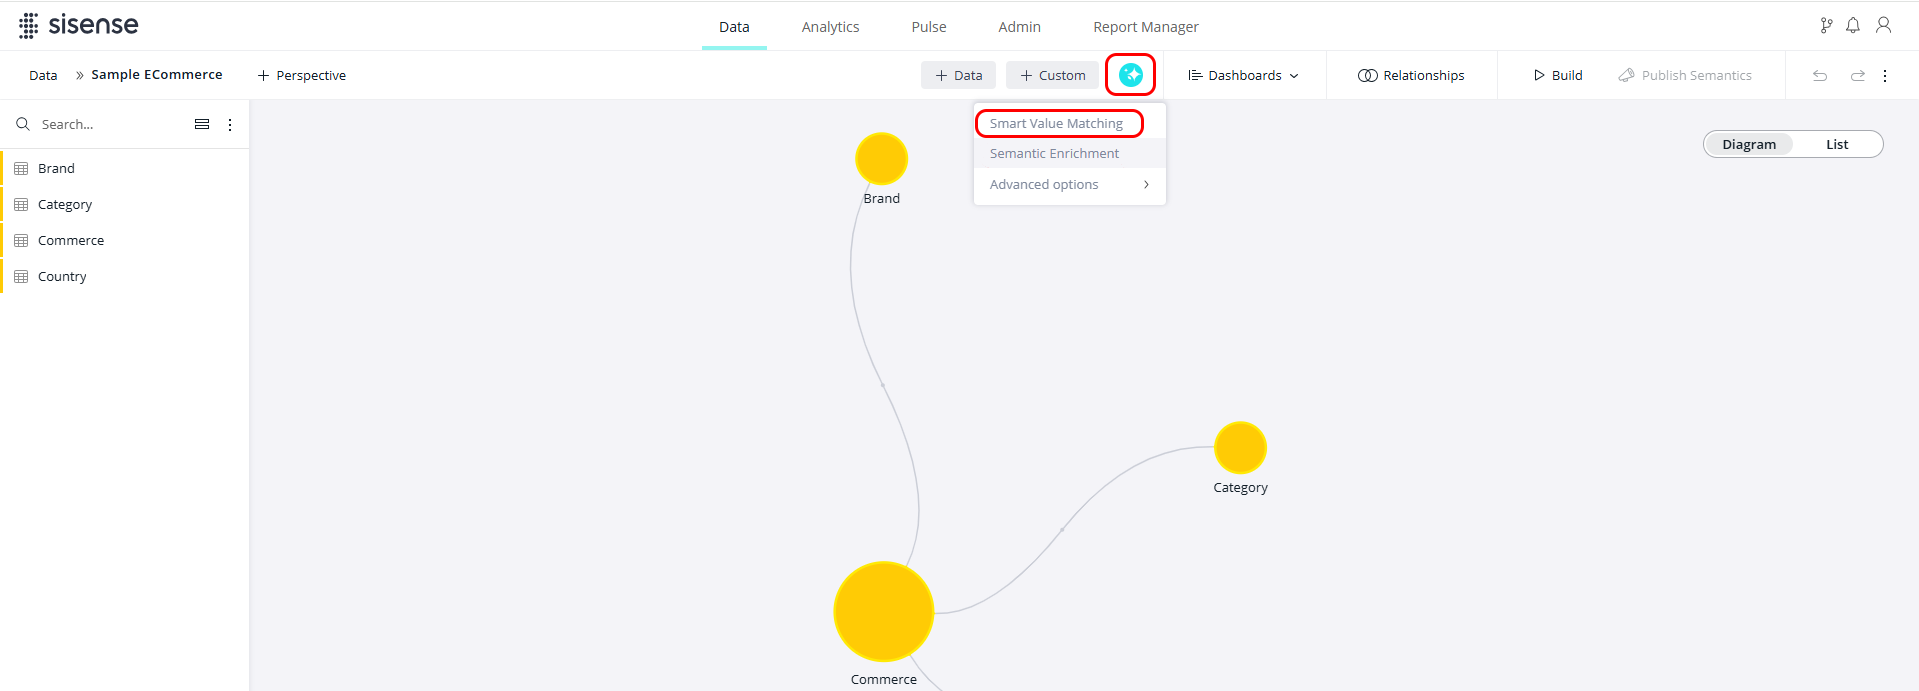
A list of available text fields that support AI Smart Matching is displayed (only columns with up to 250 distinct values are eligible).
-
Toggle Smart Matching on for the desired fields and click Save.
-
Build or publish your model in order for the settings to be applied.
AI Smart Matching values are refreshed in the following scenarios:
-
More than 30 days have passed since the last time they were indexed.
-
A new column was selected for smart matching (all other columns will be rebuilt).
-
Schema changes to the model related to the semantic index column. Sisense checks for changes that are relevant to columns that were already indexed. Changes include:
-
Column: Add, Delete, Rename, Change type
-
Table: Add, Delete, Rename
-
Note:
-
Columns with Smart Matching enabled will display
 as a visual indicator.
Using the Assistant in Dashboards
To use the assistant, click the assistant button ![]() in the dashboard toolbar.
in the dashboard toolbar.
Note:
This button is only displayed for users if the assistant has been enabled for that specific dashboard by a dashboard owner.
The assistant opens.
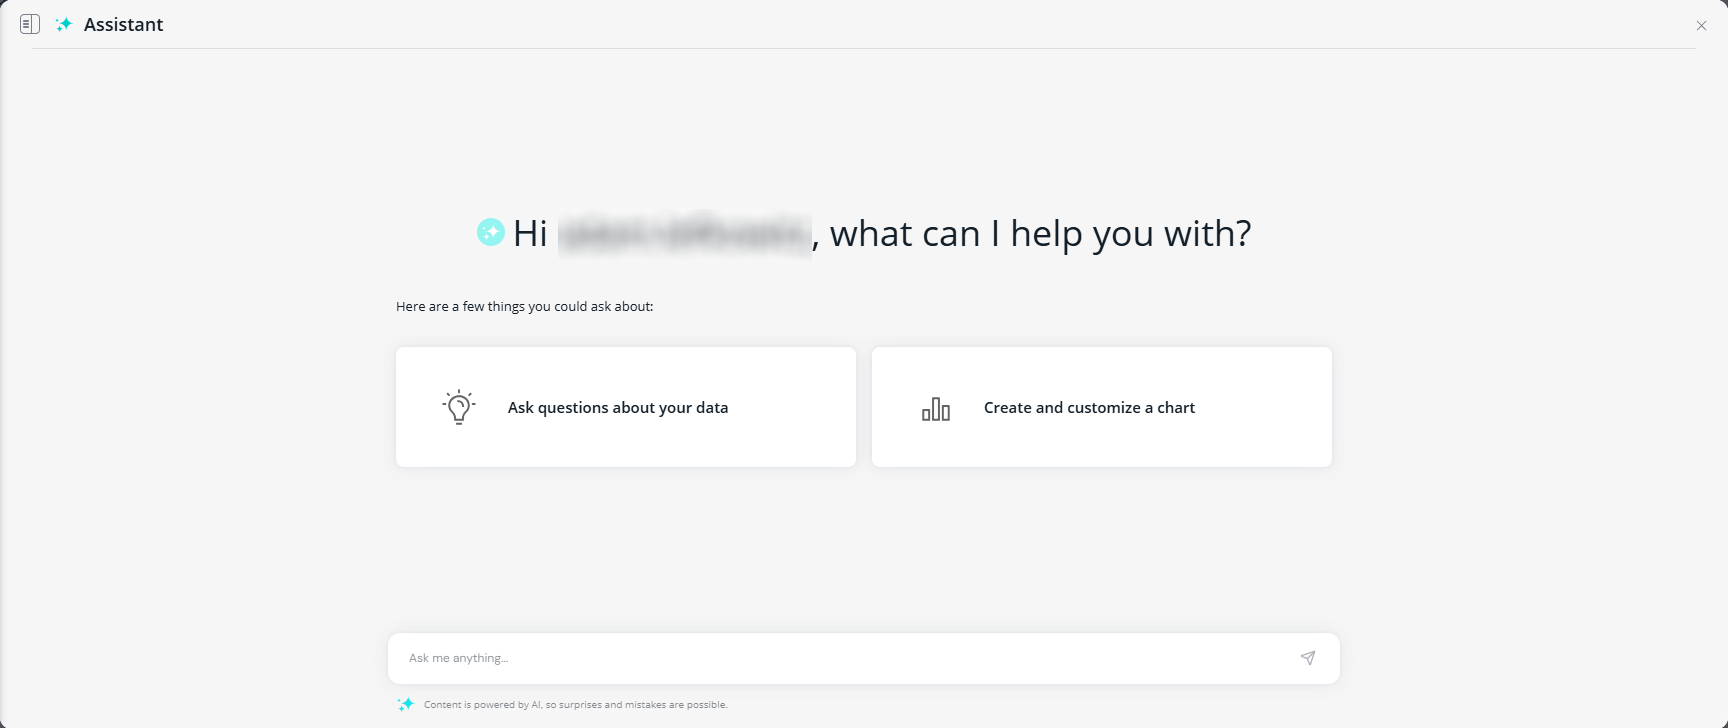
In the assistant, you can:
-
Type your question in natural language
-
Choose from suggested starter questions
Types of Questions Supported
The assistant can respond to questions about itself, your data model, and your data.
-
Ask "Who are you?" or "How can you help me?" to learn what the assistant can do.
-
Ask "How many tables are in my data model?" or "Which table has customer status?" to explore your data model.
-
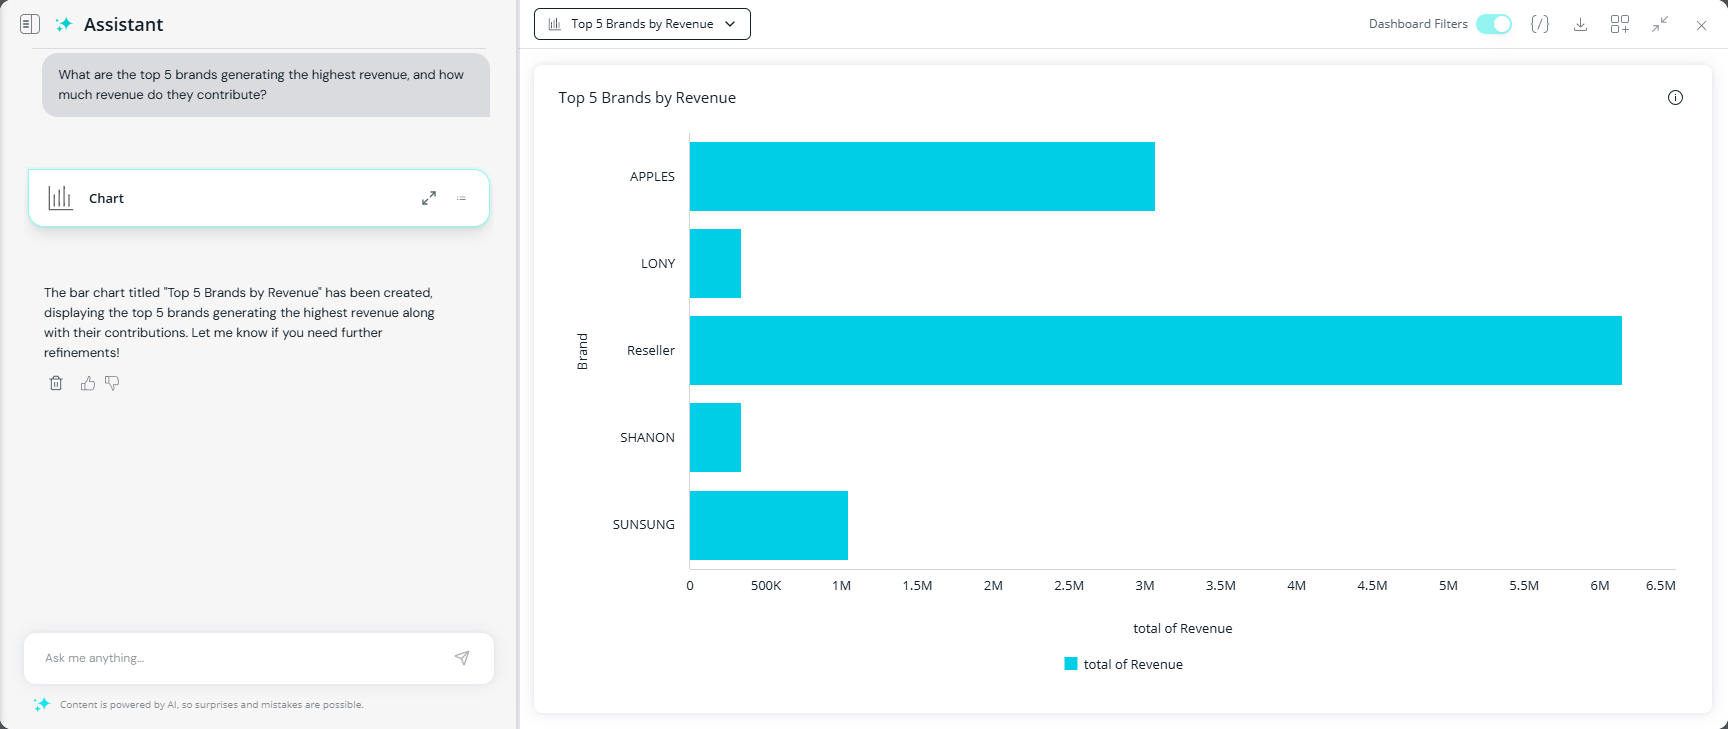
Ask analytical questions, such as "How many active customers do we have?" or "Top five regions by revenue" to generate insights and visualizations.
Before presenting results, the assistant confirms how it interpreted your question and displays relevant metadata.
Supported Natural Language Query Capabilities
The assistant supports common analytical queries, enabling users to apply familiar functions and filters in natural language.
Formulas
-
Aggregations: sum, count, countDistinct, min, max, median, average
-
Quick functions: contribution, pastYear, difference
-
Arithmetic operations using words (e.g., "revenue minus cost") or symbols (e.g., revenue - cost)
Filters
-
MemberFilter: Filter by specific values
-
FromToFilter: Filter values in a range
-
ValueFilter: fromNotEqual, from, toNotEqual, to, equals, doesntEqual, top, bottom
-
ExcludeFilter: Exclude specific values
-
LastFilter / NextFilter: Time-based filters (e.g., "last month", "next year")
-
Contains / Doesn’t Contain: Filter string values containing/excluding text
-
StartsWith / EndsWith: String matching from the start or end
-
ByTopFilter / ByBottomFilter: Top or bottom values using a metric
Visualizations
Users can request specific chart types or let the assistant choose the most appropriate one.
Supported visualizations include: Area chart, Bar chart, Column chart, Funnel chart, Indicator chart, Line chart, Pie chart, Polar chart, Table, and Treemap chart.
Results
The Results pane offers the following options:
-
Dashboard Filters: Apply the current dashboard filters to your query (enabled by default; only available for users with Designer or greater permissions)
-
C-SDK Code (
 ): Displays the Compose SDK code
 -
Download (
 ): Export the results as an image file
 -
Add to Dashboard (
 ): For users with design permissions, this option allows you to add the generated chart as a widget directly to the dashboard
Limitations and Known Issues
The assistant is evolving rapidly. We are continuously improving its capabilities both proactively and based on user feedback. As a result, some current limitations may be addressed in future releases.
Natural Language Query (NLQ) Limitations
-
No access to historical user queries: Sisense does not currently provide visibility into what NLQ questions were previously asked by users. This limits auditing, usage insights, and optimization efforts.
-
Cannot create calculated fields: You cannot ask the assistant to define a new metric using logic or arithmetic across fields. For example, "What is my profit?" will not result in sum(revenue) - sum(cost). Such formulas must be pre-defined in the data model or made available as part of the prompt context.
-
Cannot answer open-ended analytical questions: The assistant does not evaluate query results to draw conclusions or generate summaries. It builds queries based on metadata only.
-
Filters applied to specific formulas are not supported: Questions such as "What is the total revenue for females and for males?" are not supported. Workaround: Split the question into separate questions or ask, "What is the total revenue for each gender, keep only female and male."
-
Limited real-time learning from feedback: Thumbs up/down feedback is collected but does not immediately influence the assistant’s behavior.
Semantic Layer and Smart Matching Limitations
-
Semantic meaning required: Does not support numerical codes or abbreviations that lack semantic meaning.
-
No manual synonym control: Synonym detection is handled implicitly by the LLM. Users cannot configure or override it.
-
Limited support for ambiguous or poorly labeled fields: Vague field names like "value1" or "temp_field" can reduce interpretation accuracy.
-
Column names with periods (.) may cause errors: Avoid using “.” in field names.
Dashboard Awareness and Workflow Limitations
-
No awareness of existing widgets: The assistant cannot interpret or interact with widgets already on the dashboard.
-
Partial awareness of existing formulas: The assistant is aware only of shared formulas. It is not aware of other formulas in the dashboard which are not shared.
-
Cannot reference dashboard content: The assistant cannot use or cite existing widgets.
-
Cannot edit dashboards: The assistant can only add new widgets; it cannot modify or delete existing widgets.
Presentation and Styling Limitations
-
Limited styling options: Generated visuals may not match your dashboard’s formatting.
-
Manual adjustments often required: Layout, labels, and formatting may need to be customized post-creation.
Data Model Limitations
-
Schema changes: In order for schema changes to the data model to take effect, you must refresh the chat session.
Time Limitations
-
Timestamp support: The assistant only supports timestamps in units of days or longer (i.e., it does not support hours or minutes).
Stay up to date with the latest product release notes and documentation to track feature improvements and known limitations.
Embedding the Assistant
The assistant can be embedded into external applications using an IFrame alongside dashboards, enabling seamless access to the conversational interface across environments.
Creating Analytics with the Assistant
To use the assistant to create analytics, open the Assistant tab.
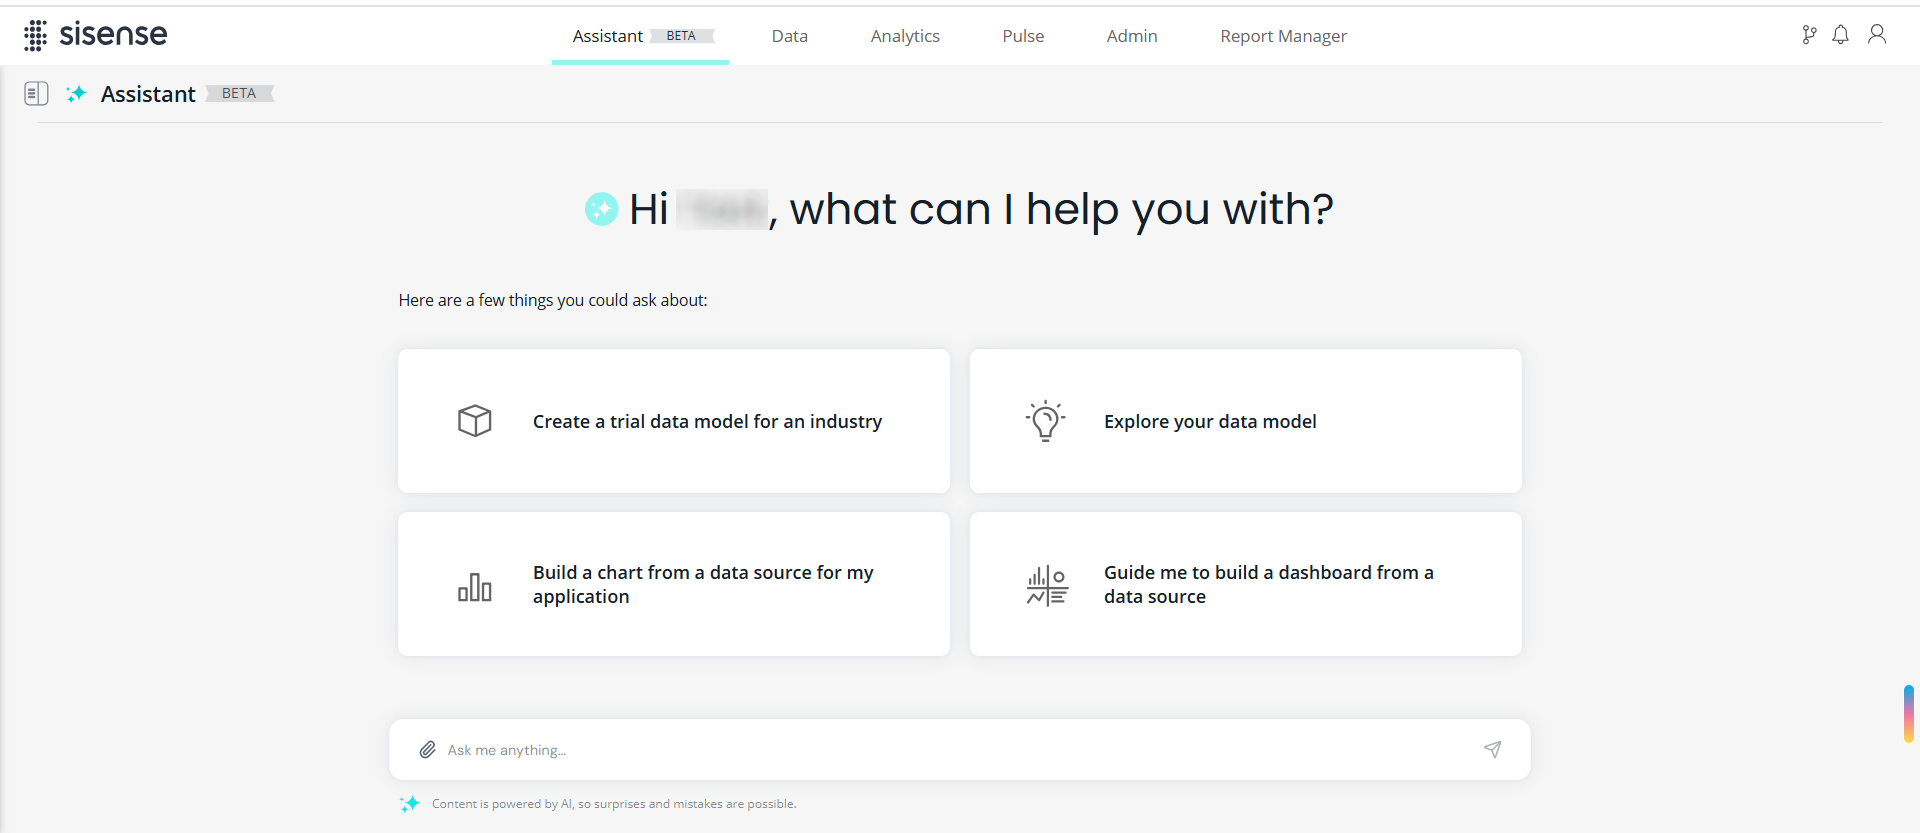
In the assistant, you can:
-
Type your question in natural language
-
Choose from suggested questions
-
Create a new chat session and navigate between sessions
-
Upload a file (pdf or image) for additional context (experimental)
Tip:
The assistant is not yet ready to handle complex data models. In order to succeed, choose a well defined data model.
The following tables depicts what you can do with the assistant:
|
Created by the assistant |
Display/Edit from Fusion |
Actions |
|
|
Data Model |
Create a data model with synthetic data |
N/A |
Save and build |
|
Chart |
Create and Modify chart attributes |
N/A |
Get embed code |
|
Dashboard |
Create and Modify a Dashboard* |
Display and Modify (only if generated by the assistant) |
Get embed code |
* Note that the assistant respects data governance rules defined in the product, and therefore you can only create dashboards on data sources with the appropriate permissions (can `use` or `edit`).
Creating Data Models from the Assistant
You can ask the assistant to create a data model:
-
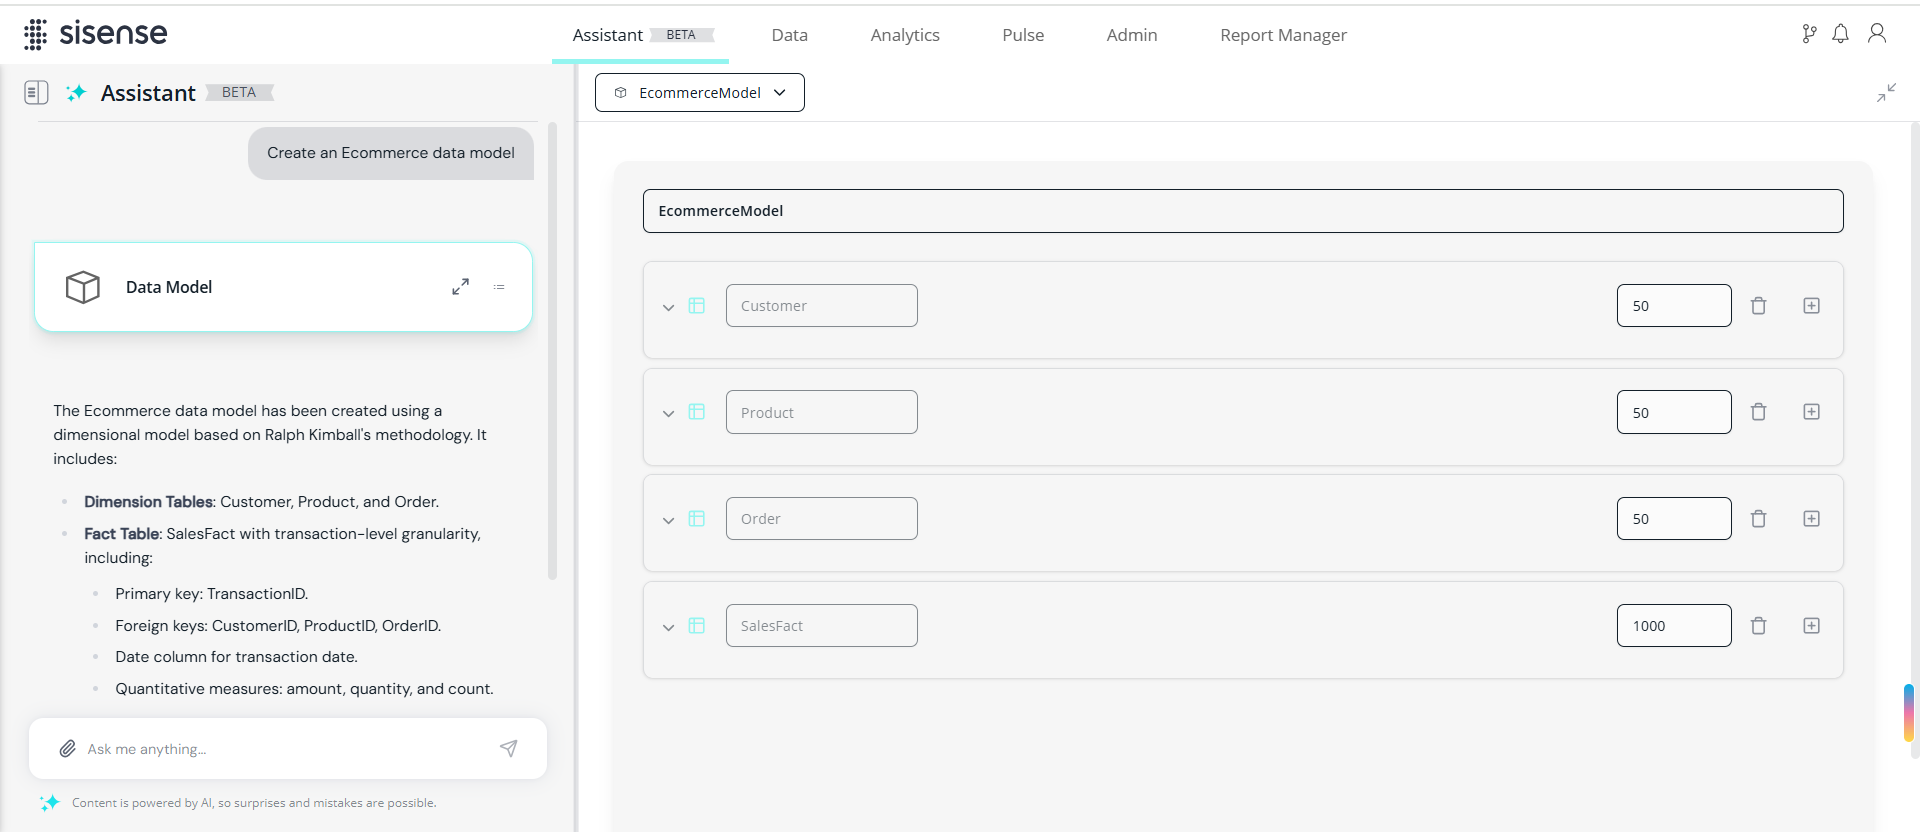
For example, in the Assistant tab, type “Create an Ecommerce data model” and press Enter.

The data model is generated and the tables to be included are displayed.
-
Review the tables to be included. Either manually or conversationally, you can add additional tables, edit the existing tables, or leave everything as-is.
-
To edit an existing table, expand the table via the drop-down, and edit the fields as desired. Note that in addition to the text/numeric fields, there are also "Faker options" fields. These are used to apply relevant constraints, such as setting date ranges, numeric limits, or custom formats, to the generated column values based on the column name. For example, to generate locations for location-based columns such as "location" and "region" or human names for name-based columns such as "customer_name" or "client_name".
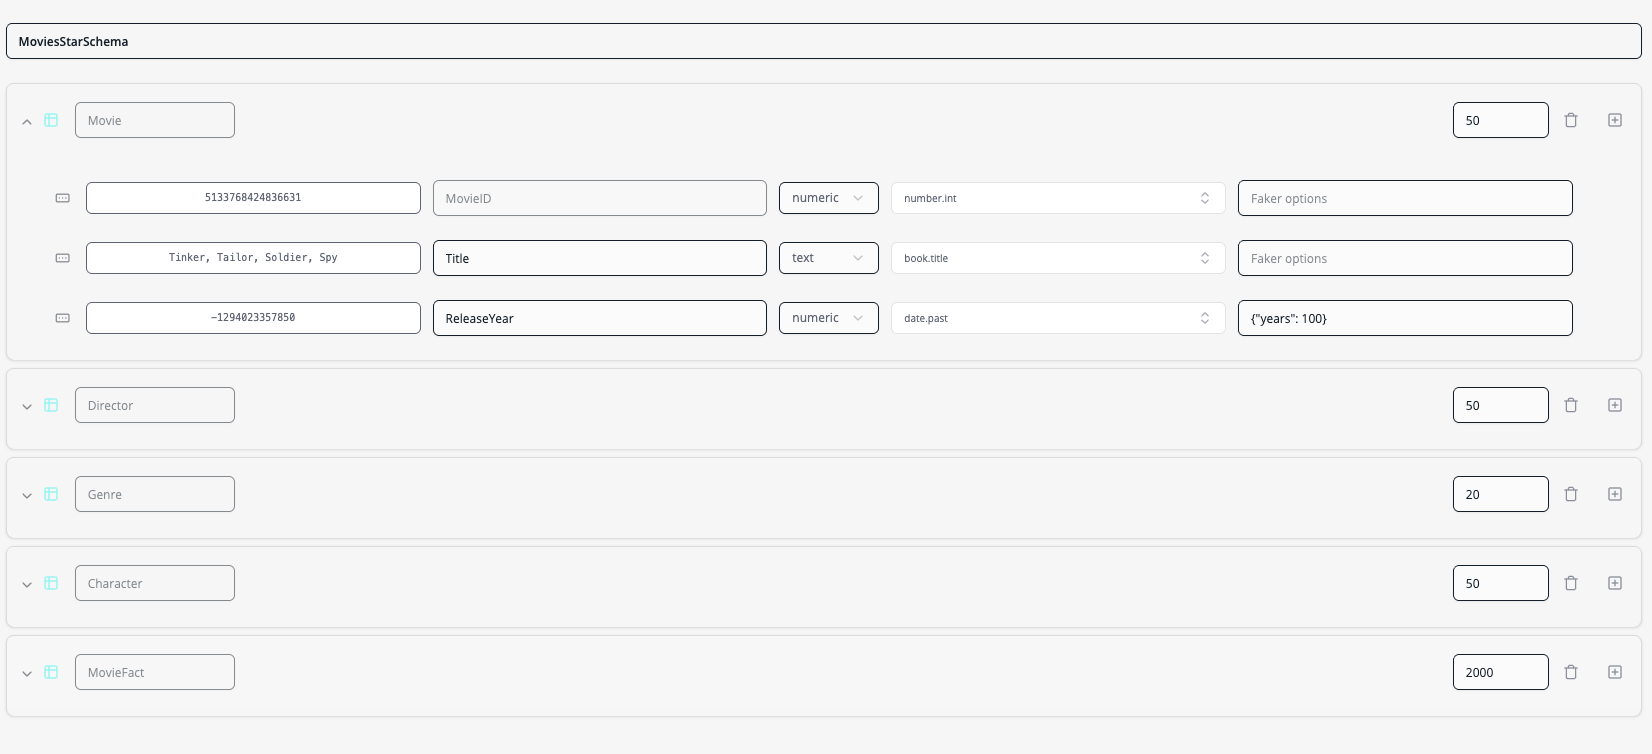
Note:
The synthetic data (generated data, not real-world data) may hold content that does not match the semantic meaning of the column. This functionality provides the user with a quick way to prototype and design the data model and visualization, without paying attention to the data insights.
-
-
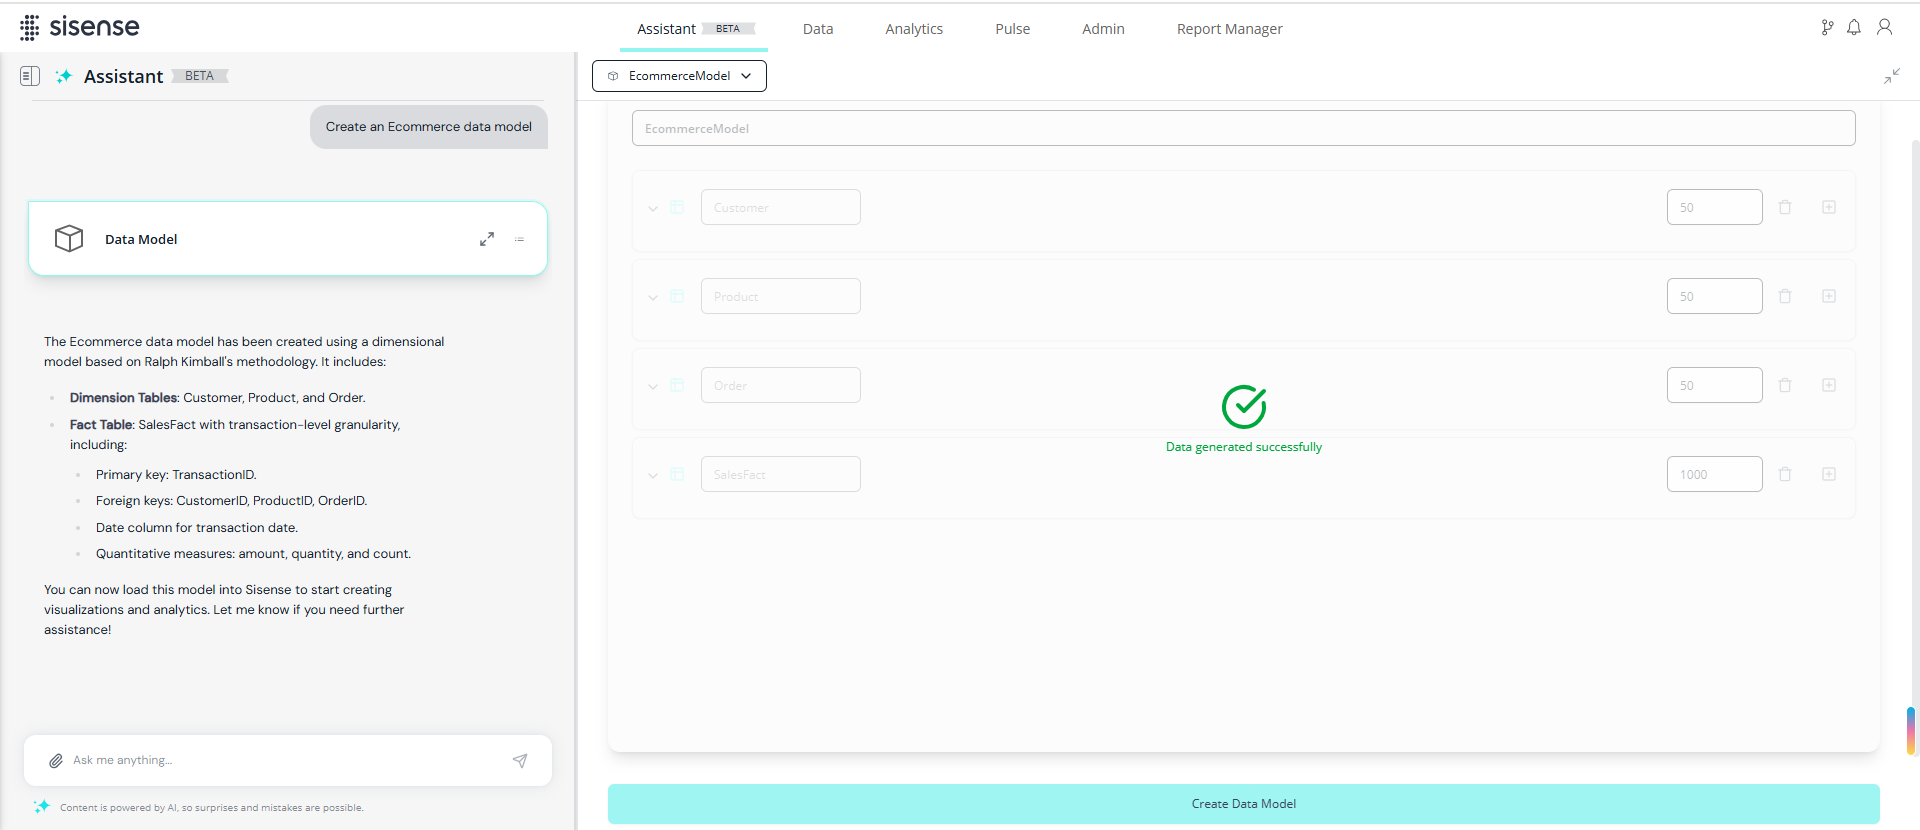
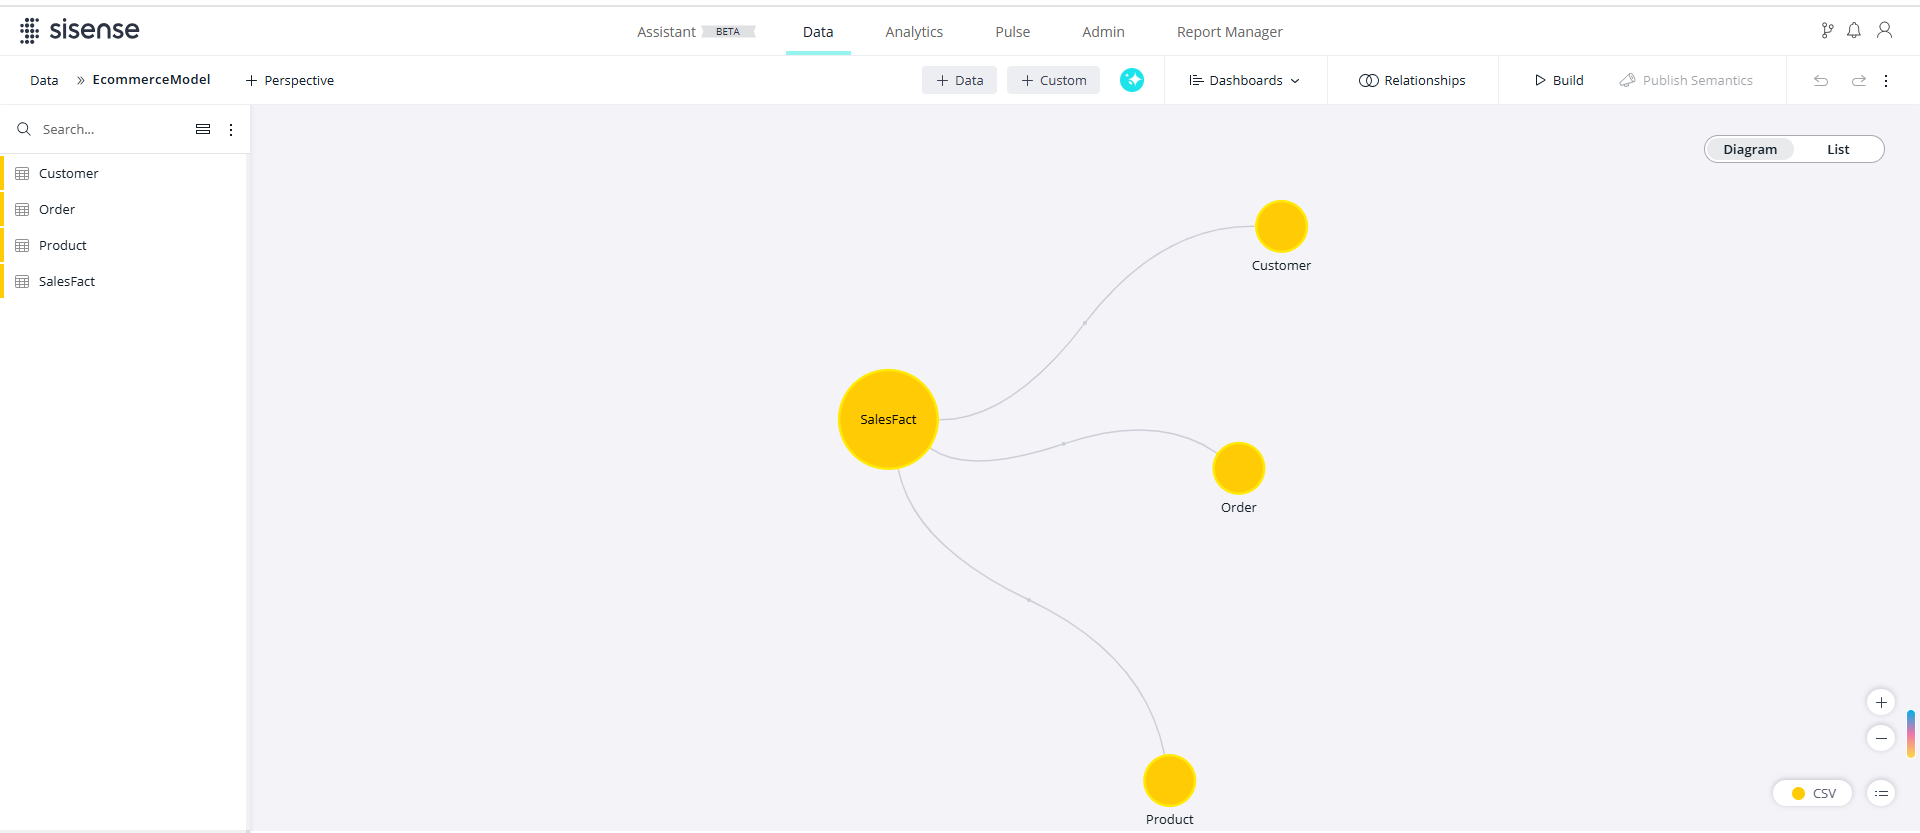
When you are ready, click Create Data Model to build the data model into an ElastiCube. When the process is complete, a “Data generated successfully” message is displayed.
-
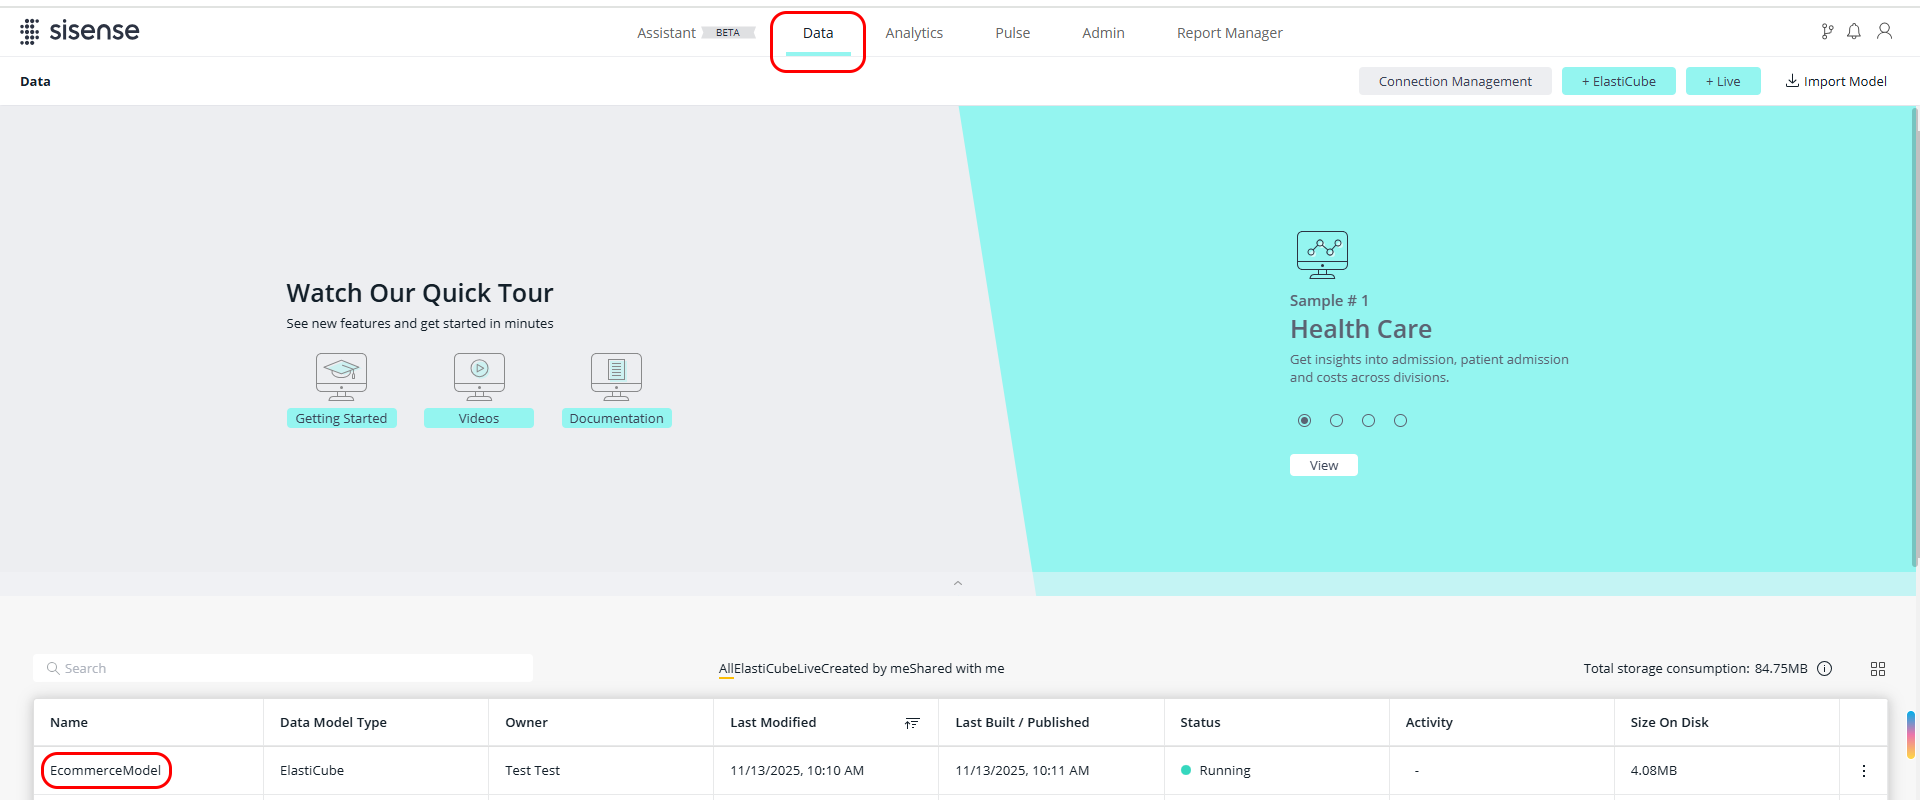
Click the Data tab and select your newly created data model to review the complete structure.
Creating, Displaying, and Modifying Dashboards from the Assistant
When creating a new dashboard via the assistant, it is saved automatically. It can then be displayed and modified later, under the Analytics tab, with all other dashboards.
You can use the assistant to create a dashboard for you, either from a pre-existing data model, or even from the data model that you created using the assistant.
-
For example (after creating a data model as described above), in the Assistant tab, type “Create a dashboard based on this data model” and press Enter.

You may be requested to select which data source to use. The assistant then generates the requested dashboard.
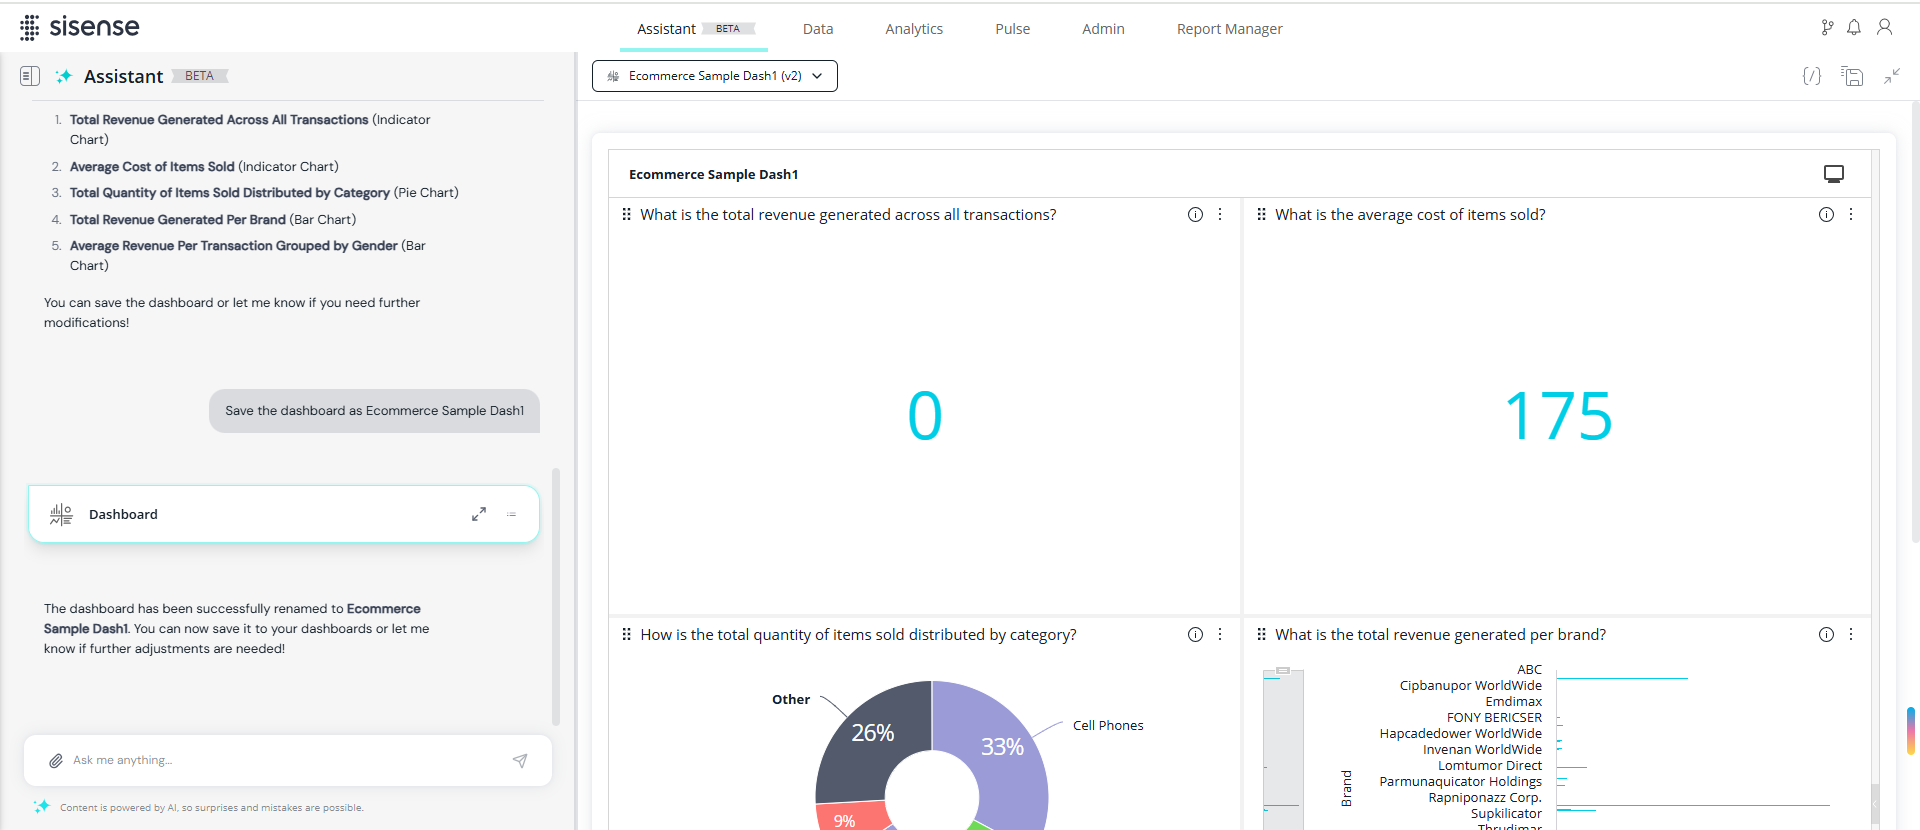
-
To save the dashboard for later viewing in the Analytics tab, click the Save button.

-
After saving it, to view the dashboard that you just saved, click Open Dashboard.

The dashboard is then displayed in the Analytics tab.
-
Click
 to customize any widget in the Widget Editor, just as you would for any dashboard.
API Reference
Sisense offers API support for working with the assistant and its underlying AI capabilities.
-
REST APIs — Support major workflows, including Generative AI setup, NLQ (Natural Language Query) execution, and completion APIs for text-based interactions.
-
Compose SDK — Provides visual components and programmatic APIs for integrating standalone assistant functionality and embedding custom experiences within applications.
To learn more, see the Developer documentation.
Frequently Asked Questions (FAQ)
Q: Does the assistant support Viewers?
A: Yes, Viewers can use the assistant to ask questions and download results, but they cannot add or edit widgets.
Q: Can I customize responses or define synonyms?
A: No. Synonym matching is handled automatically through semantic inference. Manual mapping is not currently supported.
Q: Is this a replacement for Simply Ask?
A: Yes, the assistant is the next-generation natural language query experience, offering a more intuitive and flexible interface. As the assistant matures and becomes widely available to self hosted customers, we will communicate the plan for Simply Ask.
Q: Can the assistant access or reference existing widgets?
A: No, it generates new insights and charts but does not reference or interact with existing dashboard elements.
Q: Can I train the assistant on custom business terminology?
A: Not directly. The assistant relies on your data model's metadata, including column names and descriptions. Clear, business-friendly naming improves understanding, but there is no manual training or synonym configuration at this time.
Q: How can I improve the assistant’s accuracy on domain-specific queries?
A: Use clear field names, provide descriptive metadata, and enable AI Smart Matching where appropriate. For complex or calculated metrics, consider defining formulas in the model or using perspectives to reduce ambiguity.
Q: Does the assistant retain context between questions?
A: Yes, the assistant can remember previous questions within the same session and respond to follow-ups that build on earlier prompts. However, it does not have access to the results of the queries it generates, so it cannot answer questions based on the outcome of a prior query.