Adding Notebook SQL Charts to Dashboards
Last updated: June 11, 2026
| Tier | Deployment |
|
|
When you work in Notebooks creating charts and doing ad-hoc analysis, you want to be able to share your insights with business users. You can do this by adding your charts as a widget to a dashboard. The business users can then view the data and make changes, such as editing the chart type or filtering the dashboard.
These changes by business users only affect the widget on the dashboard, not your source chart in the Notebook.
Add a Chart to a Dashboard
Adding a chart to a dashboard requires two steps:
- Selecting a dashboard
- Selecting a Live Model
Adding a chart to a dashboard is only supported for Notebooks that connect directly to Live databases. This is not supported when using shared connections to connect to an ElastiCube or a Live data source. (Shared connections are connections that have been shared with the user in the Data tab.) See Connecting Notebooks to a Data Source to learn more about the different types of Notebook connections.
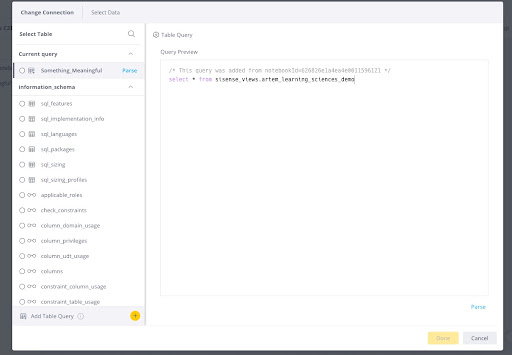
Select a Dashboard
- On the chart block in your notebook, click
.png) . The Chart to Dashboard window
opens.
Note:
. The Chart to Dashboard window
opens.
Note:
This icon is only relevant for chart blocks, not code blocks.
/
.png)
- Select a dashboard as follows:
- To create a new dashboard, select New Dashboard and enter a name for it. The new dashboard is added to the dashboard list in the Analytics tab. You will be listed as the owner of the dashboard.
- To add your chart to an existing dashboard, select Your Dashboards and search for the
required one. If you have shared charts already, the last dashboard you shared to is selected by default. When
you hover over the dashboard name, a panel shows information about it.
- Dashboards are user-specific, so users can only share to dashboards they own, and the only dashboards that will be shown will be owned by the user. For example, two different Data Designers can add a chart to a dashboard from the same Notebook, but the chart will show on a different dashboard for each designer, as they each own their own dashboards.
- You can only share charts to dashboards you have created. This ensures that you are sharing the chart to
the original dashboard and not to copies of the dashboard that someone else may have created, and where the
data may have been distorted.
.png)
Sisense recommends that if you are not planning on designing the dashboard yourself, then you give ownership to whoever will be designing it. See Sharing Dashboards.
Select a Live Model
When you share the chart, a live model updates with the new information by adding an SQL statement to update the dashboard.
- Select a live model as follows:
- To create a new live model, select New Live Models and enter a name for it. The new model is added as a tile in the Data tab.
- To add your chart to an existing live model, select Your Live Modelsand search for the
required one. Only published models display in the drop-down. The last live model you selected is automatically
selected in the list. When you hover over the live model name, a panel shows information about it.
Note the following:
- New Live Models can only be created by the Notebook owner.
- New Live Models are published automatically when the chart is added.
- All models you have permissions to edit are displayed, but only models that share the same connection as the Notebook can be selected.
- System uses the block name as the table name in the model:
- You will be prompted to create a unique table name or Overwrite. See Overwrite a
Table vs. Add a New Table.
- You will be shown the dashboard/widget dependencies that could be negatively affected.
- You can see if a table was generated from the C2D workflow.
- Display a comment with the Notebook ID in the select data window.
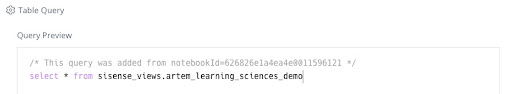
- Display a comment with the Notebook ID in the select data window.
- You will be prompted to create a unique table name or Overwrite. See Overwrite a
Table vs. Add a New Table.
- All design changes that happen in Notebooks are respected on the Dashboard.
- Dashboard security - Data Security is maintained as long as it is set up as part of the model. But there are no security gaps in functionality.
- Filters applied in a notebook are not retained when the chart is added to a dashboard, so the information
will look different. You will need to recreate the filter to obtain the same information as the notebook
chart (see Creating and Editing Filters):
- Once the chart appears as a widget on the dashboard, a user can create additional filters on the dashboard.
- If filters are applied in the notebook, you may need to go into the model and manually create relationships between the tables.
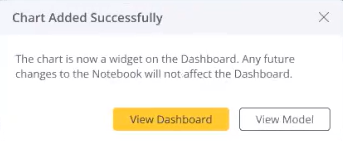
- Click Add to add the chart. A popup displays confirming the chart was added
successfully.
Once the chart is added to the dashboard, the following applies:- Notebook filters do not apply to the dashboard.
- Charts are relevant only to Notebooks. Once the chart is shared to a dashboard, it is considered a widget and the behavior is the same as other widgets in the dashboard.
- Existing and new dashboard filters can be applied to the new widget.
- Once published, the widget will NOT automatically refresh if the original widget in Notebooks is modified. In short, a snapshot of the widget and its data are published. There is no subsequent link to Notebooks.
- Select View Dashboard to open the dashboard in a new tab or View Model to open the model page in a new tab.
Overwriting a Table vs Adding a New Table
The name of the table that is added to the model comes from the name of the SQL cell in Notebooks. When a SQL query with the same name is added, either by a chart or a model update, a warning message displays.
You can either:
- Provide a unique table name
.png)
- Override the existing model - Overwriting the table changes the table data in the model to the new query.
Depending on how much difference is in the overriding query, this means that any chart or dashboard that requires
this table to run might be impacted because it may be overridden with a completely different set of data.
.png)
Updating a Live Model without Adding a SQL Chart
You can update a live model without adding a chart to a dashboard using an SQL code block.
To update a live model from an SQL code block:
- On the code block in your notebook, click
.png)
- Make the required selections and click Add to add the live model to the Data tab.
.png)
- Click View Model to view the model.