Using R in Formulas
R is a software environment for statistical computing and graphics. Sisense supports the integration of R functions in your formulas.
You can write R code directly in the formula editor, and send fields as parameters. You can also combine R functionality with the regular functions to create advanced and tailored formulas. (For general help with the formula editor and functions, click Formula Editor.)
Before you can integrate R into your formulas, you must have an R server set up in your organization.
This document covers the following:
Understanding How R works in Sisense
Within a widget, R code is used and assigned fields as parameters, the following happens:
-
The selected fields are sent fully to R as a list of arrays.
-
The R code is executed on the R server, referencing the fields as needed.
-
The numeric results from R are sent back to the widget for visualization.
Each request from the R server is done in a self-contained namespace, so R variables and results can't be reused across requests unless they're loaded from a saved location.
R calculations are computed in the R server, and not in the ElastiCube , this means that for larger data sets results won't return as fast as regular widgets.
Running R on Windows
If your R server is running on Windows you'll be bound to the concurrency limitations the R distribution has on Windows. This means that concurrent requests to R may return wrong results.
Connecting Sisense to Your R Server in Windows
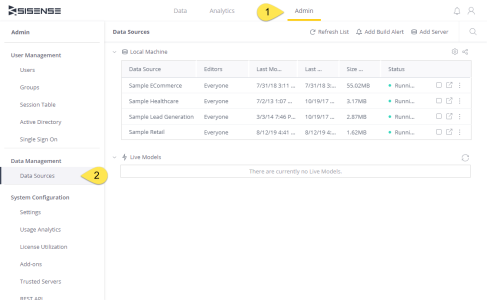
To connect your Sisense instance to your R server:
-
In the Admin page, select Data Sources.
-
Click
 to open your Data Settings.
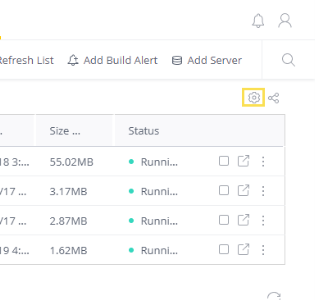
-
Enable the R Serer Address switch.
-
In IP, enter the IP address of your R server.
-
In Port enter the port of your R server.
-
Click Save after you have successfully tested and connected to your R server.
-
To use the configured R server with a specific ElastiCube , stop and start the relevant ElastiCube . In the dialog that appears, select the option to restart your ElastiCubes.
Installing Rserve
Sisense can only connect to a running Rserve instance. For more information about installing and running Rserve follow this link.
Please note that if you’re using RStudio, Rserve still has to be installed.
Using R functions in Formulas
Using R code in Sisense is achieved by using two dedicated formulas – RINT & RDOUBLE. Depending on the result type of your R code, use the appropriate function within the Formula Editor.
For either formula, RINT or RDOUBLE, the return type has to be an exact match.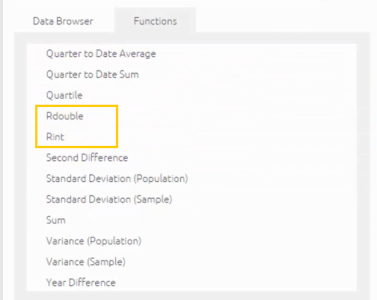
Multiple numeric field values can be passed as parameters to the R functions, which within your R code can be accessed via the ‘args’ argument (See K-means example below).
Syntax:
RINT([recycle (true)], [<Ordering>], <R expression>, [<numeric value 1>, ...,
<numeric value n>] )
RDOUBLE([recycle (true)], [<Ordering>], <R expression>, [<numeric value 1>, ...,
<numeric value n>] )
Sisense doesn't support the use of a final ‘;’ in R statements. If you add a semi-colon at the end of your R statement, the code will fail.
Parameters:
-
Recycle true/false (default = true) – This is an optional parameter that controls whether the results from R should be recycled (cached), so that consequent queries won't have to be recalculated unless they or the data have changed. Generally, this behavior is automatically managed by the ElastiCube automatically for all functions. However, since R code might have non-deterministic components to it (such as randomality functions or date-specific functions), the ElastiCube can't rely on a data-set and function that hasn’t changed not to return a different result in multiple executions.
By default, the Recycle value is set to true. Use ‘off’ if your R code contains randomality or other non-deterministic content.
-
Ordering – This is an optional parameter that defines the sort order in which numeric data is sent to R. The argument of the Ordering parameter can be an index in your data source or you can use the ORDERING() function to determine the order of your fields. This function arranges the values of the arguments into ascending or descending order, breaking ties by further arguments.
For example:
ORDERING([Total Sales], -1*[COUNT Salesman], MIN(<Office Name>))For more information about the ORDERING() function, click here.
-
R expression – Your R code needs to be passed here, wrapped in double quotes. R expects the return type to be an array with the same size as widget’s row count. Nulls will be used to make up for shorter arrays, and longer arrays will be trimmed.
Use single quotes to wrap strings within your R code when using the Rint/Rdouble functions, so that there will be no double-quote collision with the quotes wrapping your R code within the Rint/Rdouble function.
-
Numeric Value Arguments – Numeric values can be passed as arguments to your R code.
-
All arguments are passed to R as a 1-based list named “args”. Each item in the list contains an array that represents the field.
For example:
- args[[1]] will return an array which represents the first field that was used as an argument.
- args[[2]][3] will return the 3rd data value within the 2nd field that was used as an argument.
Guidelines for using R code in Sisense
In order for your R code to work well in Sisense you need to make sure of the following:
-
The resultset returned from R into Sisense has to be equal in size to the dataset that is sent to R as parameters.
-
The order of the resultset return from R into Sisense has to match the incoming order. No assumptions can be made about the incoming order – This means that you can't assume that the incoming order matches the order you visually see in the widget.
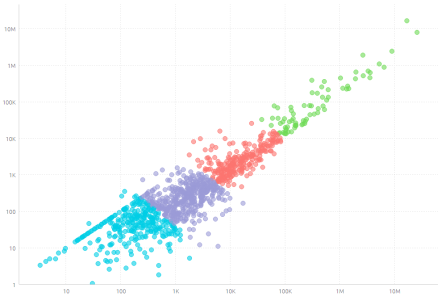
Example 1: Simple R Function – Kmeans Clustering
Description: In the example below the Total Cost and Total Revenue fields from Sisense are being used to cluster data via a Kmeans function. The result will cluster the data based on the kmeans settings, in this case 4 clusters.
Sisense Syntax:
RINT(TRUE, "m<- log(matrix(unlist(args), ncol = 2));
kmeans(m,4)$cluster" ,[Total Cost],[Total Revenue])
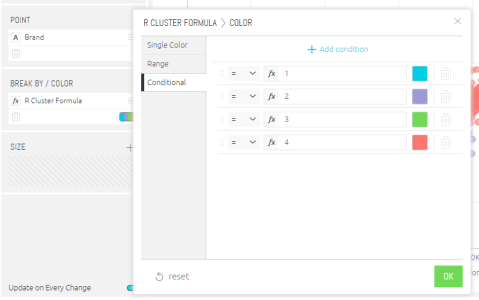
Result: The R expression will return a result from 1 to 4. The widgets color settings can be configured to color corresponding values based on if they equal 1, 2, 3 or 4.
Tip :
You can Formula Editor the complex formula above, and use it again in additional formulas and charts.
In the chart’s BREAK BY/COLOR panel, you can change the color of the clusters as well as define the number of clusters and their break points.
Example 2: R Logistic Regression via Sisense
Description: In the example below website traffic data is used to predict if a conversion is likely to occur based on the source of web traffic. The following fields contained in the ElastiCube are passed to the R logistic model: Average Outcome (1=conversion, 0= no conversion), Average Time on Page, Average Pages (viewed) and Average Bounce Rate. This data is passed to a model to predict the outcome and likelihood the traffic will convert.
[For the sake of illustration both the training and test data set are the same in the example]
Sisense Syntax:
RDOUBLE(TRUE,"mydata<-data.frame(convert=args[[1]], time=args[[2]],
pages=args[[3]], bounce=args[[4]]);lrmodel <- glm(convert time + pages +
bounce, data = mydata, family = 'binomial');prob <- predict(lrmodel, newdata =
mydata, type = 'response')", [Average Outcome], [Average TimeonPage], [Average
Pages], [Average BounceRate])
Result: The R expression will return a result from 0 to 1 showing the likelihood of a conversion occurring. Note a similar process can be applied to create a linear regression.
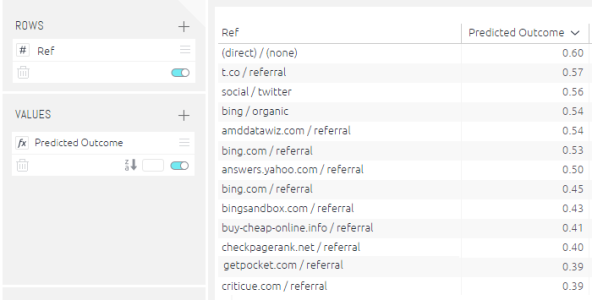
Predicted outcome of website conversion based on logistic regression.
Example 3: Loading an Existing R Model
Description: In the example below a saved logistic regression built on previous training data is called and used with new website traffic data to predict if a conversion occurs. The following fields contained in the ElastiCube are passed to the saved R logistic model: Average Outcome (1=conversion, 0= no conversion), Average Time on Page, Average Pages (viewed) and Average Bounce Rate. This data is passed to a model to predict the outcome and likelihood the traffic will convert.
Sisense Syntax:
RDOUBLE(TRUE,"mydata<-data.frame(convert=args[[1]], time=args[[2]],
pages=args[[3]], bounce=args[[4]]);load('C:\rdata');prob <- predict(lrmodel, newdata =
mydata, type = 'response')", [Average Outcome], [Average TimeonPage],
[Average Pages], [Average BounceRate])
Result: The R expression will return a result from 0 to 1 showing the likelihood of a conversion occurring based on the loaded R model in this case stored in ‘rdata’.
Example 4: Building and Saving a R Model using Data from Sisense
Description: In the example below a logistic regression to predict if a website conversion will occur is built using data from Sisense and then saved as an R model. The following fields contained in the ElastiCube are passed to create the R logistic model: Average Outcome (1=conversion, 0= no conversion), Average Time on Page, Average Pages (viewed) and Average Bounce Rate. This data is saved as an rdata file and can be used on other data sets to predict outcomes.
Sisense Syntax:
RDOUBLE(TRUE,"mydata<-data.frame(convert=args[[1]], time=args[[2]],
pages=args[[3]], bounce=args[[4]]);lrmodel <- glm(convert time + pages +
bounce, data = mydata, family = 'binomial'); save(lrmodel, file = 'C:\rdata')
;1", [Average Outcome], [Average TimeonPage], [Average Pages], [Average
BounceRate])
Result: The R expression will use Sisense data to build and save a logistic model in the specified file in this case ‘rdata’.
.r.