Creating Formulas Based on Criteria and Conditions (Filters)
Often formulas must take into account specific criteria. To do this Sisense provides a feature called Measured Value, which like the SUMIF function in Excel, only performs a calculation when the values meet a set of criteria.
Criteria for Measured Values may be based on any logical operators in a filter.

To filter the formula:
-
In the Data Browser, create your formula from the Data Browser and Functions, as explained in Formula Editor.
-
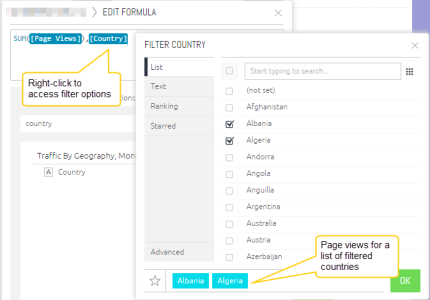
Add the field (criteria) by which you want to filter the formula. Right-click the field and select Filter.
-
You can then filter the formula by listed items, text options, ranking, etc. When done, click OK.

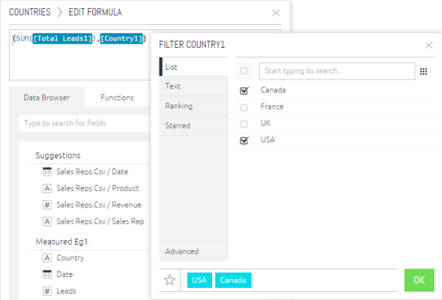
A simple example of Measured Value is the use of a list filter. A marketing team may need to count leads generated for a specific region such as North America. Even if leads come from many different countries, the measured value calculates leads generated only when the lead originates from the United States or Canada.

The above example as defined in the Formula Editor.

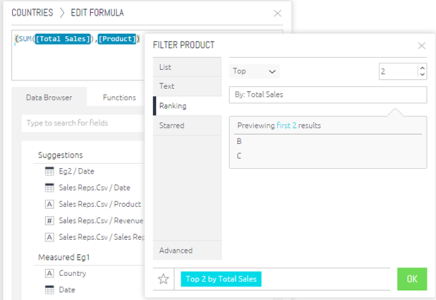
A more sophisticated case is the use of a ranking filter, for example a sales team may want to track the contribution of best-selling products to total revenue. However, what constitutes a popular product may change over time. A measured value can be created for sales which includes a condition that only shows sales for the top products for any month. This simultaneously filters the data but also takes into account changes in what classifies as a top product over time.

The above example as defined in the Formula Editor.

Measured Values are a powerful feature to take into account business logic and quickly perform calculations only when a specific set of criteria is met.
Note:
If your widget is filtered using measured values, then the measured value will override any other widget or dashboard filters you have for the same fields.
Calculating Contributions Using the ALL Function
The All() function returns the total amount for a dimension, and can be used for various use cases. In the following example, we will use the All function to calculate how much each country contributed towards the total cost of a campaign.
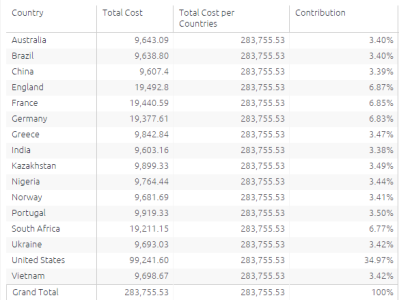
The final widget includes the following information:

Step 1: The second column above represents a formula that sums up the total cost for all countries and does not represent the breakdown per country. The formula includes the calculation (total cost) followed by the all function (filter), followed by the dimension (country) in parenthesis. It looks like this:

We can save (star) the above formula and call it Total cost for Countries, which will be used in the next step.
Step 2: We can now use the above formula in another formula to calculate the contribution, like this:

The result is the third column above (plus formatting the results as percentages).
.r.