Scatter Map
Last updated: June 11, 2026
| Tier | Deployment |
|
|
|
Important:
From 15 December 2020, Sisense uses an updated version of Mapbox to generate Scatter Maps. If you have an on-prem version of Sisense with Scatter Map widgets from prior to that date, perform a simple configuration to get the map upgrade. See Scatter Map - Mapbox Upgrade.
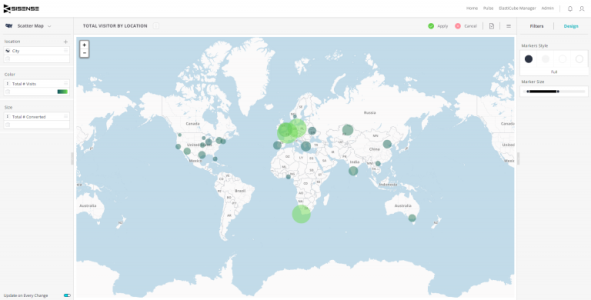
Scatter Maps allow you to visualize geographical data as data points on a map. Sisense uses a cloud service to load the background tiles of the map, and position data points on the map using a geocoding service.
Note:
The maximum amount of data points is 500.
The map distinguishes data using different colors and sizes for the data points on the map.
For a short video overview of scatter maps, see below:
Adding Data
In the Location panel, you can add any field(s) that contain geographic data, and the map will find the most appropriate point. Supported Location types:
- Country
- City
- State/Province
- Latitude/Longitude (for example: 37.5601, -122.50131, but not 37.5601° N, 122.50131° W).
For example, if you have a country field, using it by itself will visualize the countries on the map.
If instead you have a city field, using it will visualize the cities on the map automatically.
Improving Geographic Accuracy
Use multiple geographic fields
To improve accuracy, it is recommended to use more than one geographic level. For example, if you have both a country and a city field, add both of them to the Location panel.
Defining the location type
Clicking on the geographic field's menu will present a location type sub-menu, which contains the following options:
-
Auto
-
Country
-
State/Province
-
City
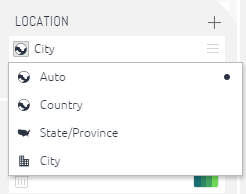
By default, Auto is always selected. This option always tries to figure out which fits best. For better accuracy, you can specify the appropriate location type.
Using Latitude and Longitude data
To visualize latitude and longitude data, you have to add one field containing latitude data, and another field containing longitude data, in this order.
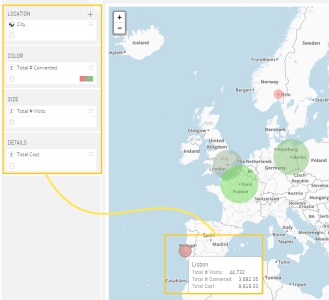
Color
Select a numeric field here to color the scatter points on the map according to their value and color rule.
The value of the field is displayed in the tooltip of the scatter point on the map. Hover over the point to see it.
Size
Select a numeric field here to make the size of the scatter points on the map relative to their value in the field's value range.
Details
You can select additional data (numeric or descriptive) that will appear when hovering over the data point in the map.
Designing the Scatter Map
Fine-tune the appearance of the Scatter Map Widget, using the following tools.
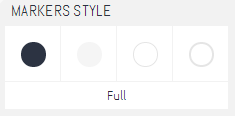
-
Marker Style: Choose between various marker styles.
-
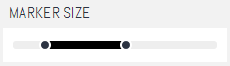
Marker Size: Select the relative size for the markers.
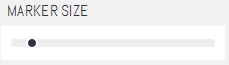
When the Size has a field in it, the slider has two levers controlling the minimum and maximum size of the points.