Query Plan Analyzer vs. JAQLine
Below is a comparison of a widget which was analyzed once with the JAQLine add-on and once with the Query Plan Analyzer.
Note: JAQline is no longer supported.
Original query:
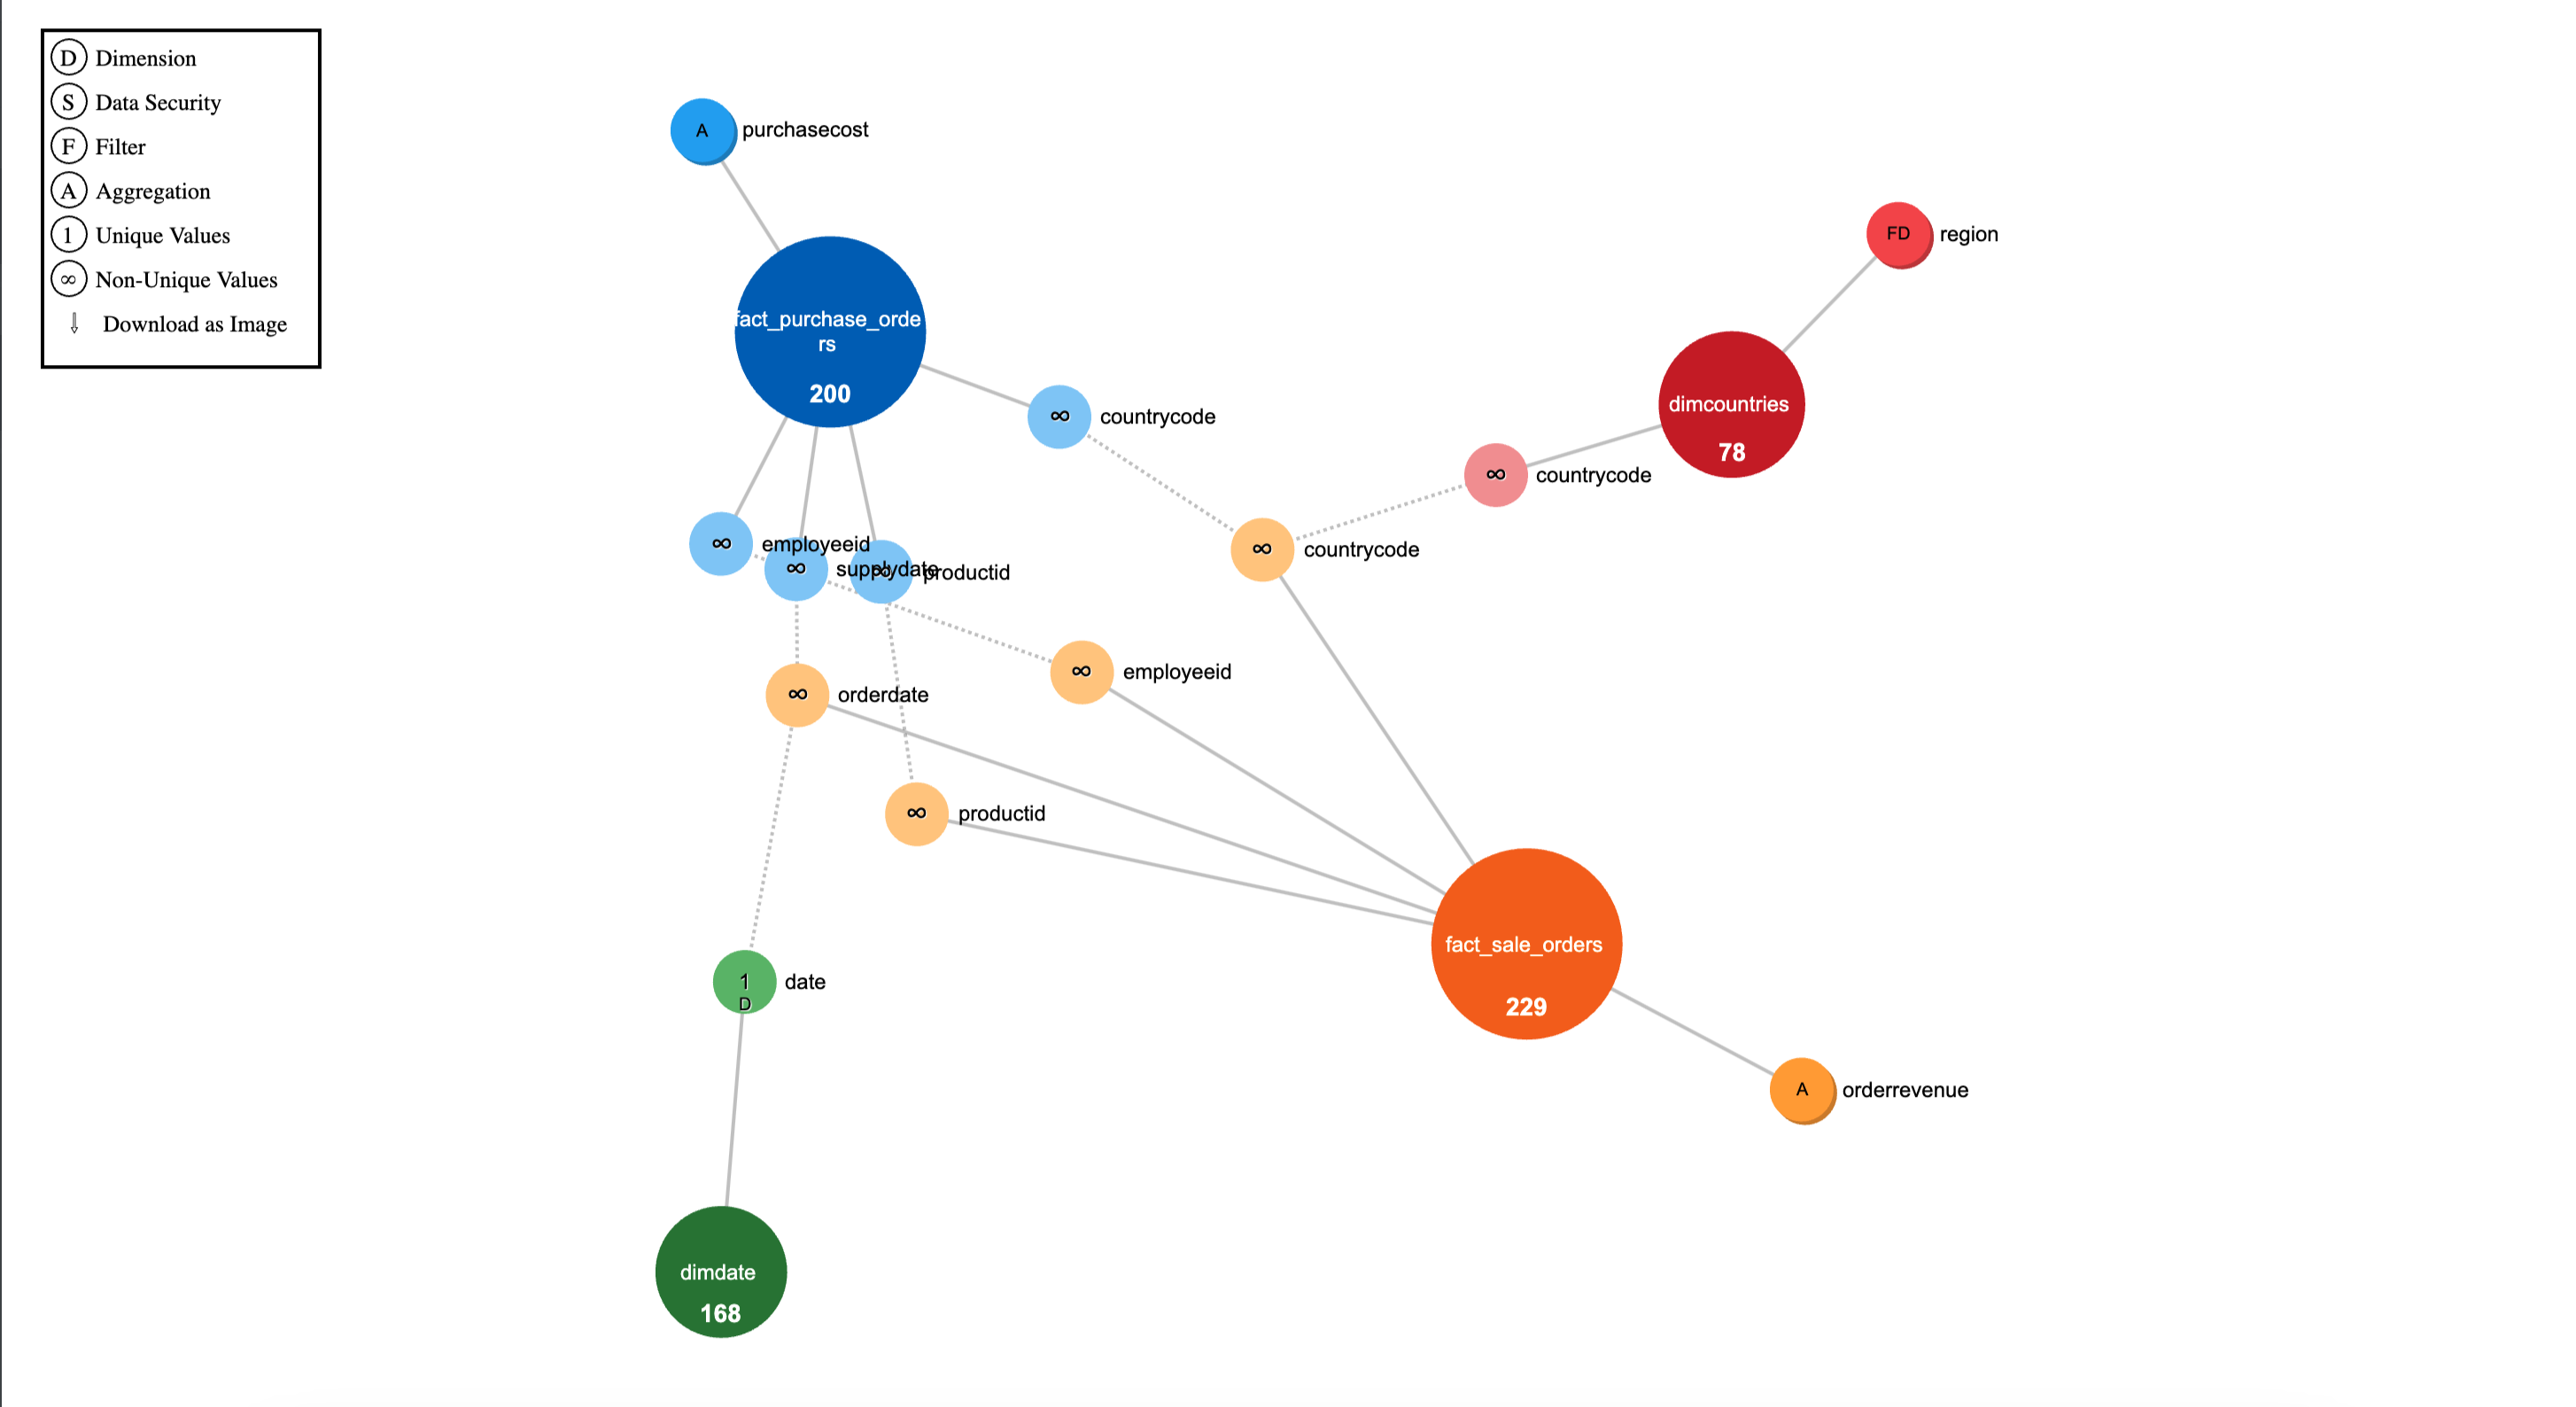
JAQLine graph:
QPA graph:

Note:
The results of the JAQLine might differ from the results of the Query Plan Analyzer, since the Query Plan Analyzer is based on the New Analytical Engine, while the JAQLine uses the Old Translator. In general, the New Analytical Engine is both more deterministic and more accurate, and JAQline is no longer supported.
Below is a comparison of each table and its components:
-
DimCountries:
In the JAQLine, you can see that the DimCountries table has one filter on the Region column and two joined connections on the CountryCode dimension. Also, the JAQLine shows that the CountryCode is non-unique and that the row count is 78.
In the Query Plan Analyzer, you can see that the DimCountries is a SOURCE TABLE that was filtered by ‘Region’ = ‘Europe’ and used the CountryCode in order to filter the columns in Fact_Sale_ordrs.
Unlike from the JAQLine graph, you can understand from the Query Plan Analyzer graph that the purpose of the DimCountries in the SQL is only for filtering. You can also see that the row count is 78 according to the edge that exits the SOURCE TABLE DimCountries vortex.
-
Fact_Sale_orders:
-
In the JAQLine, you can see that Fact_Sale_orders has several columns that are used for join and one aggregation - orderrevenue. However, it is difficult to understand the order of the joins in the SQL. The row count is 229.
-
In the Query Plan Analyzer, you can see that there are a total of 2 vortexes that have a SOURCE TABLE of Fact_Sale_orders. Which corresponds to the number of SELECT FROM Fact_Sale_orders in the SQL. Each vortex has a row count of 229, and we can see the selected columns for each of the vortexes represent the CROSS JOIN that will be executed later on or the aggregation for the OrderRevenue field.
-
-
Fact_Purchase_Orders:
-
In the JAQLine, you can see that fact_purchase_orders has several columns that are used for join, and one aggregation - purchasecost. However, it is hard to understand the order of the joins in the SQL. The row count is 200.
-
In the Query Plan Analyzer, you can see that there are a total of 2 vortexes that have a SOURCE TABLE of Fact_Purchase_Orders. This corresponds to the number of SELECT FROM Fact_Purchase_Orders in the SQL. Each vortex has a row count of 200, and you can see the selected columns for each of the vortexes represent the CROSS JOIN that will be executed later or the aggregation for the PurchaseCost field.
-
-
dimDate:
-
In the JAQLine, you can see that the dimDate was part of the SQL and it played a part in the Join actions between the different tables. Therefore, it could have impacted an M2M use case. However, when examining the SQL, you can see that dimDate was in fact not part of the SQL, and therefore it is not represented in the Query Plan Analyzer graph. This demonstrates that the Query Plan Analyzer is more aligned with the SQL than the JAQLine is.
-
Bottom line: The Query Plan Analyzer details the query in a more accurate and deterministic way than the JAQLine. It provides additional information, such as the filters that were used with each table, and also detects M2M relationships. In addition, it still shows all the Aggregations, Selected Columns, and row counts as the JAQLine.