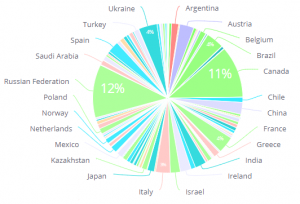
Pie Chart
The Pie chart is used to display proportional data, and/or percentages.
Adding Data
-
In the Categories panel, click Add + to select the data that will be displayed in the Pie Chart. You can add only one field.
Typically, the categories of a Pie Chart contain descriptive data.Note:
All slices that are smaller or equal to 3% are grouped together into a slice called Other. You can hover over this slice to display its breakdown.
-
In the Values area, select the field whose values determine the size of the pie slice by clicking Add +. Values are typically used to represent numeric data.
Note:
You can add only one field.
Designing the Pie Chart
Fine-tune the appearance of the Pie Chart widget, using the following tools:
-
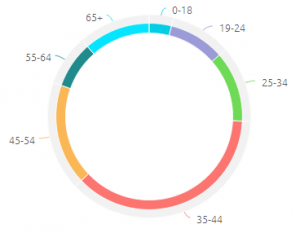
PIE TYPE : Select how the pie appears.
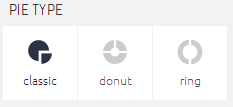
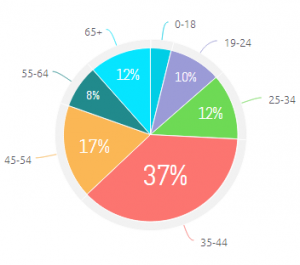
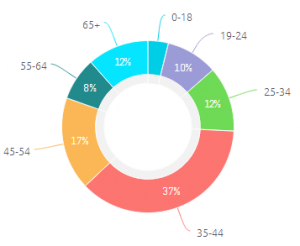
-
Legend: Specify whether to show or hide the Legend, and select its position. To add a title to the legend, so that users understand clearly which dimension is displayed in the chart, see here.
-
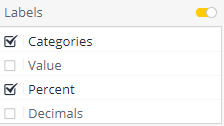
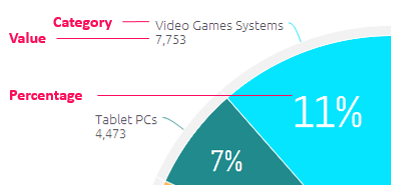
Labels: Select which labels to display on the pie chart, as indicated below:
Note:
Sisense rounds up numbers in Pie charts and this may lead to the percentages totaling to 101%.
-
Show 'Others' Slice: Toggle this setting to control the display of the 'Others' slice:
- Include in the 'Others' slice all categories (slices) smaller than X percent (%), OR
- Show X slices, and group all the rest into the 'Others' slice
-
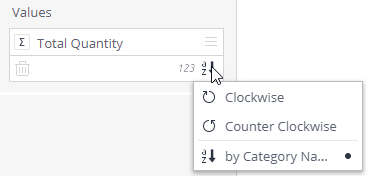
Set the direction of slices: Click the

Sort button in the Values section in the Data panel to set the direction of slices:- Clockwise or counter clockwise by category percentages
- By category name (from A to Z, or from 1 and higher)
Exploring Pie Charts
You can Drilling Down in a Widget into pie charts just like other widgets. In addition, when your pie chart has so many smaller slices that they are aggregated into a single slice called Others, you can click this slice to display a second pie chart containing a breakdown of the Others slice.
For example, the pie chart below displays a breakdown of the top 5 slices in a pie chart with many smaller slices included in the Others slice.
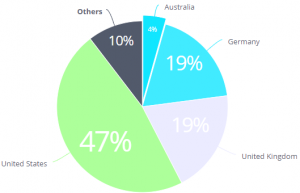
By clicking the Others slice, you can see a breakdown of all the slices included in the Others slice.
