Measured Values
Formulas often must take into account specific criteria. To do this, Sisense provides a feature called Measured Value, which, like the SUMIF function in Excel, only performs a calculation when the values meet a set of criteria. Criteria for measured values may be based on any logical operators in a filter.
Measured values are used to:
-
Cancel/Replace a dashboard/widget filter for a widget
-
Cancel the slicing/Group By effect
There are four measured value functions:
-
All
-
Prev
-
Next
-
Now
For detailed information about each of these functions, see the Measured Value Functions section in Dashboard Functions Reference.
Terms and Definitions
-
Simple measure - A measure that has only one level/pass of calculation.
-
Slicer - A slicer is a dimension that is used to divide the results into groups.
-
Filter - A filter restricts the result set to those that meet the filtering criteria.
Example:
(X, SUM (Y))
-
SUM (Y) is the simple measure
-
X is the slicer dimension
How Filters Affect Results
Filters can be applied at different levels. The Analytical Engine uses the highest precedence filter for its calculations.
For calculations, the order of precedence of filters is:
-
Filters on measures
-
Widget filters
-
Dashboard filters
For more information about filters, see Active Filters in Widgets.
Presentation filters determine which rows of the result set are displayed. Calculation filters affect the values of the result set; that is, the values for each row of the result set. If the calculation and presentation filters are different, the results displayed may seem strange, even though they are correct.
In calculations, when measured values have filters, the filters are applied first to generate the result set, and then the formula is calculated for the rows of the result set.
Examples:
(sum(X),all(Y)) - In this formula, the all filter instructs the Analytical Engine to ignore any widget and dashboard filters when calculating sum(X).
(sum(X),f(Y)) - In this formula, the f filter is applied to rows that contain the value Y to generate the result set, and then sum(X) is calculated on the rows in the result set.
If you do not select any member of the filter in the measured value, it is as if the action of measured value does not exist, and the results will be the same as the simple value, (the same as the results without a filter).
The All function is used for cases in which you do not want to use a filter, and you want to cancel a dashboard/widget filter, and cancel the slicing/Group By effect. If you use the All function, it does not matter if you selected a filter or not (for example, to view other data), the All function ensures that the measured value functionality will take place, (i.e., the cancellation of the dashboard/widget filter, and the cancellation of the slicing/Group By effect). In this case, your results are a type of indicator. This means that there will be only one result, and that same result will be displayed in each row.
Using the All Measured Value Function
In the example below, you can see the grouping (slicing/Group By) in each row of the first column (Age Range), the simple value results in the second column (Total Revenue), and the results of the Measured Value with the all function in the third column ("(sum([Revenue]),all([Age Range]))").
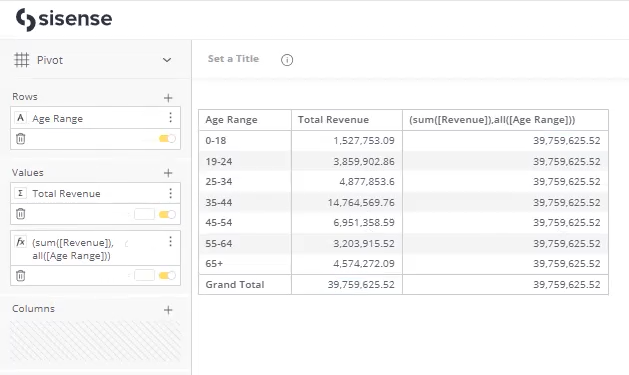
As you can see above, the results in the third column return the same value for each row, which is the total of the simple values for all of the age ranges together. That is what is meant by the cancellation of slicing/Group By, (in this case, of the grouping by age ranges).