Forecasting Future Results
You can forecast future values based on historical data. The flexible forecast settings allow you to easily change a parameter and see how it affects future values, so you can understand which scenario will help you meet your targets and take the right business decisions.
Note:
Sisense views your security very seriously. Sisense Forecasting does not require cloud access.
In versions prior to L2023.3, data was sent to the cloud service. Starting with L2023.3, Forecasting no longer requires cloud access.
Forecasting can be applied to the following widget types:
- Line chart
- Area chart
- Column chart
After you have applied forecasts to your widgets, you and your Viewers can view the results and interact with the widgets.
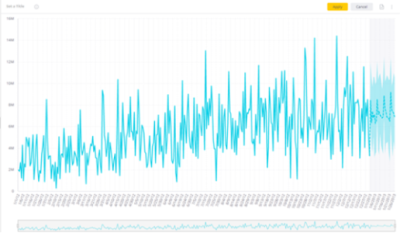
Watch this video for a brief explanation of Forecasting:
Note:
If you are currently using the Forecasting add-on, perform the steps detailed in the section Migrating from the Forecasting Add-on before using Forecasting in your dashboard.
How it Works
Sisense's AI engine uses an AutoML-like approach. By default, the AI engine runs an ensemble of forecasting models, using AI to assign different weights to each of them in order to create the most accurate forecasting.
Note:
If you do not select an explaining variable, you can manually choose just one of the available forecasting models for Sisense to use to calculate the forecast.
Forecasting Model Types
You can forecast your data based on your previous data and the type of information you want to forecast.
Sisense uses "Ensemble" as the default forecasting approach. For example, when "Ensemble" is used for univariate forecasting, a machine-learning powered calculation automatically runs 4 different models (Auto ARIMA, Prophet, Holt-Winters, and Random Forest) on the historical data. Then it compares their output with the actual historical results, and selects the model, or blend of models, that best suits the specific dataset to create the forecast.
Alternatively, (for univariate forecasting only) you may choose to apply any of the individual models (via the Forecast settings), except Random Forest (which is not available when manually choosing a single model). In this case, we recommend testing first which model works best with your data by selecting one of the models, then running "Compare to previous forecast" from the settings to see how accurately the model was able to predict compared to actual historical data.
Univariate Forecasting
For univariate forecasting, you select one variable to forecast over a time dimension. For example, you could forecast future revenues over a certain time period based on past data.
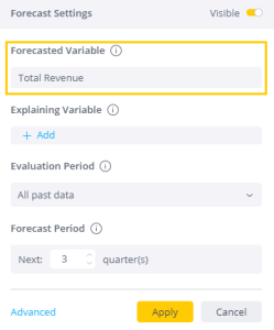
The AI engine driving this type of forecast uses the following models:
- Auto ARIMA
- Prophet
- Holt-Winters
- Random Forest (only used in the ensemble approach, you cannot choose it manually)
Multivariate Forecasting
For multivariate forecasting you select one forecasted variable and one explaining variable (see Explaining Variable) over a time dimension.
Note:
If you select an explaining variable you cannot select a specific algorithm for calculating the forecast.
For example, let's say you suspect that your buyer age range has a significant effect on your total revenue. You can check that hypothesis by setting "age range" as the Explaining variable, and watching how it affects your predicted revenue. In this way, you can test different factors to see how they affect the predicted behavior of your metric.
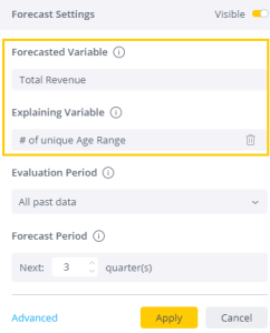
The AI engine driving this type of forecast uses the following models:
- CatBoost
- ElasticNet
- Random Forest
Explaining Variable
The optional use of an "Explaining Variable" turns the forecast from the default univariate forecast into a more advanced type of forecasting called multivariate forecasting.
By default, if you do not select an explaining variable, the forecast is a univariate forecast. This means that it is calculated based only on the historical values of the KPI that you are forecasting. For example, if you are forecasting Sales, it only looks at the historical values of your Sales over time.
When you select an "Explaining Variable" the multivariate forecast is based on a time series that contains both your forecasted variable and the explaining variable. Multivariate forecasting is useful when the question you are asking is "Is variable 1 influencing variable 2 (the forecasted variable), and if so, how?" It helps you check your hypotheses on the effect of certain factors over others. For example, if you want to forecast your Sales over time, and you want to check whether your pricing is affecting your sales, you can select Price as the explaining variable. The multivariate forecast calculates the forecast for Sales, while taking into account a dependency on the values of Price over time.
How to select an explaining variable depends on your business knowledge and the hypotheses you have about the behavior of the different factors in your data. Try it out with this thought in mind: "Let's check if and how different variables may be affecting my forecast, to get additional insights".
Note:
Univariate forecasting (without an explaining variable) requires 30 historical data points, while multivariate forecasting requires 60 points.
Implementing Forecasting
To use Forecasting in Sisense, do the following:
- Activate Forecasting - Forecasting is enabled by default. If it has been deactivated, it must be re-enabled by your Sisense Administrator. To (re)enable Forecasting, select Feature Management from the Admin tab. In the AI section, toggle on Forecast and click Save.
- Adding Forecasts to Widgets - If the widget is one of the supported types (Line chart, Area chart, Column chart), you can add Forecasting to it.
- Customize the time periods - Select how many time periods ahead to forecast.
- (Optional) Change the confidence measure - Set the probability of the forecasted value to be located within the error bands, see how it affects the forecast, and find the level that is right for you.
Adding Forecasts to Widgets
Your Sisense user role determines how you interact with the Forecast feature. Designers add forecasting to widgets that Viewers can then use and customize. Viewers can customize the forecasting definitions to ensure that forecasting is done according to the preferred business logic.
To add forecasting to your widgets:
- Create a widget with one of the supported widget types (Line chart, Area chart, Column chart):
- In the Data panel, place a time variable on the X-axis and the time-dependent variable that you want to forecast on the Y-axis.
- Click the
 icon under
the forecasted variable and select Forecast.

- Toggle on the Visible control at the top of the Forecast Settings window to enable the forecast.
- The read-only forecasted variable is the time-dependent variable that you selected. If you want to add an additional variable, add one in the Explaining Variable field.
- In the Evaluation Period field, select whether you want to use all your past data for the forecast
or only a recent period, and select the period.
Note:
The minimum number of data points required for a reliable forecast is 30 data points for univariate and 60 data points for multivariate forecast.
- In Forecast Period, indicate how many data points into the future to predict.
-
Select Advanced for additional options:
- In Confidence, select the desired confidence level to set the upper and lower prediction
bands in accordance with your business requirements. You can choose between confidence coefficients ranging from
80% to 99%. This percentage indicates the probability of the forecasted value to be located within the error
bands.
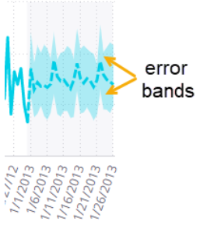
In general, the higher the coefficient, the larger the error boundaries, which increases the chance of the predicted value to be included within them. The lower the coefficient, the better you'll be able to see the forecasted trend. - Set the Boundaries Limitation to define limits for your forecast so only realistic values are
displayed. You can define the following limitations:
- Value - Select the checkbox and enter a minimum value below which forecasted values aren't considered.
- Value - Select the checkbox and enter a maximum value above which forecasted values aren't considered.
- Numeric values cannot contain a fraction - Select to contain only integers in your forecast.
-
If an Explaining variable wasn't selected, in the Type field, Sisense recommends that you leave the default "Ensemble" value for the most accurate forecast. Alternatively, you can select the desired model from the list.
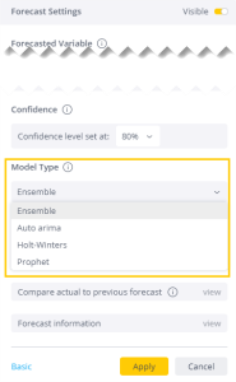
See Forecasting Model Types for more information.
- In Confidence, select the desired confidence level to set the upper and lower prediction
bands in accordance with your business requirements. You can choose between confidence coefficients ranging from
80% to 99%. This percentage indicates the probability of the forecasted value to be located within the error
bands.
-
Click Apply. The forecasted period with values and their prediction bands is added to the chart. You can also see a summary of the forecast, see Viewing the Forecast Summary for more information.
Note:
Click the forecast line of the widget to quickly adjust the forecast settings.
"Ignore" Time Periods When Calculating a Forecast
If you experienced irregular data behavior (such as unusually low sales due to holidays), you can choose to exclude those time periods from the historical data on which the forecast is based. These excluded time periods are ignored when the forecast is calculated.
Note:
You can only exclude time periods from the beginning or end of the time series (for example, the last x months). To do this, select Recent Period from the Advanced menu. You cannot exclude time periods from the middle of the time series.
To exclude time periods from the data for forecasting:
-
Edit a widget that displays data over time and that has a forecast applied.
-
In the Evaluation Period drop-down, select Recent Period.
-
Set the number of months you want to include in the forecast.
-
Set the number of "last" months you want to ignore (exclude).
Note:
Your historical data must include at least 30 data points to calculate a forecast. Therefore, if you exclude data points from the evaluation period, make sure you still have at least 30 points overall (as shown in the example, below).
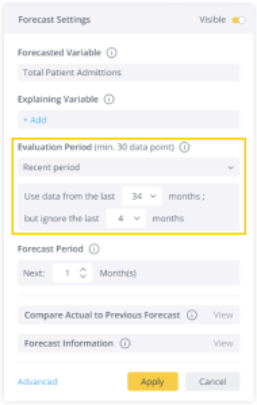
Ensuring Accurate Results
One of the primary concerns of Viewers who leverage forecasting is the accuracy of the forecasted results. Sisense enables you to evaluate the accuracy of the forecast by comparing it to existing data.
By default, the forecast ensembles receive only 85% of the data displayed in the widget. When evaluating forecast accuracy, the remaining 15% (the most recent 15% of the values) are displayed alongside the predicted values for the same period. This way you can compare the performance predicted by the forecasting model against actual performance, see the size of the error, and modify your forecasting settings accordingly.
To evaluate forecast accuracy:
- Once the forecasted period is displayed in the widget, click Analyze It.
-
Select Forecast > Actual vs. Forecast. (This option appears only after you have run the forecast.)
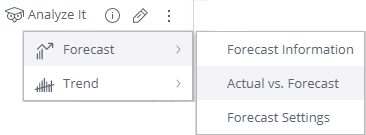
The comparison graph appears.

- To close the comparison window, click anywhere outside this window.
Viewing the Forecast Summary
Once the forecast is built, you can see the settings it was built with.
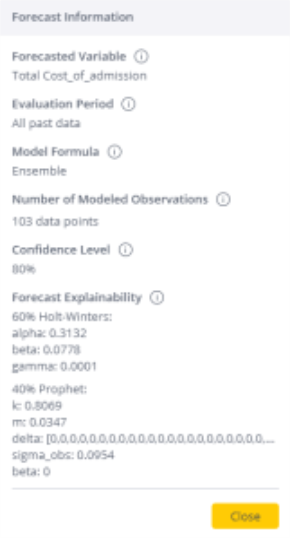
If the selected forecasting model was "Ensemble", this will show you the statistical outputs and the respective weights of the models in the ensemble to create the most accurate forecasting. If a specific model was selected, its statistical output will be shown.
When an Explaining variable is selected, the relationship score between the target and the Explaining variable will be shown to indicate the accuracy of the choice of the Explaining variable, (the closer to 1, the more related those variables are).
To view the forecast summary:
- Once the forecasted period is displayed in the widget, click Analyze It.
- Select Forecast > Forecast Information.
(This option appears only after you have run the forecast.)
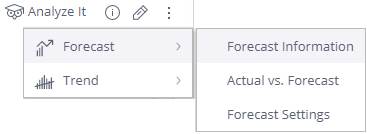
The Forecast Information panel appears.
Example:
In the example below you can see that the model that was selected was "Ensemble" with 60% of the weight on Holt-Winters and 40% of the weight on Prophet.
Migrating from the Forecasting Add-on
If you are using the Forecasting add-on, perform the following steps to switch to using native Forecasting and trend lines in Sisense:
- Disable the Forecasting add-on. For more information, see Working with Sisense Add-ons. This removes the Forecast and Trend lines from any widgets on which the add-on was applied.
- A Sisense Admin needs to activate Forecasting. To enable Forecasting, select Feature Management from the Admin tab. In the AI section, toggle on Forecast and click Save.