Creating and Using Dashboards - Quick Start Guide
What we will do here
You have imported your database into the Sisense app for Analytics. To get useful insights, you will next set up interactive dashboards for your viewers. Here, we will walk you through the first steps of getting a dashboard up and running. Once you have the “gist of it” you will be able to continue using the Introduction to Dashboards.
Let’s go!
-
In the Sisense app, select your imported database or one of the supplied examples:
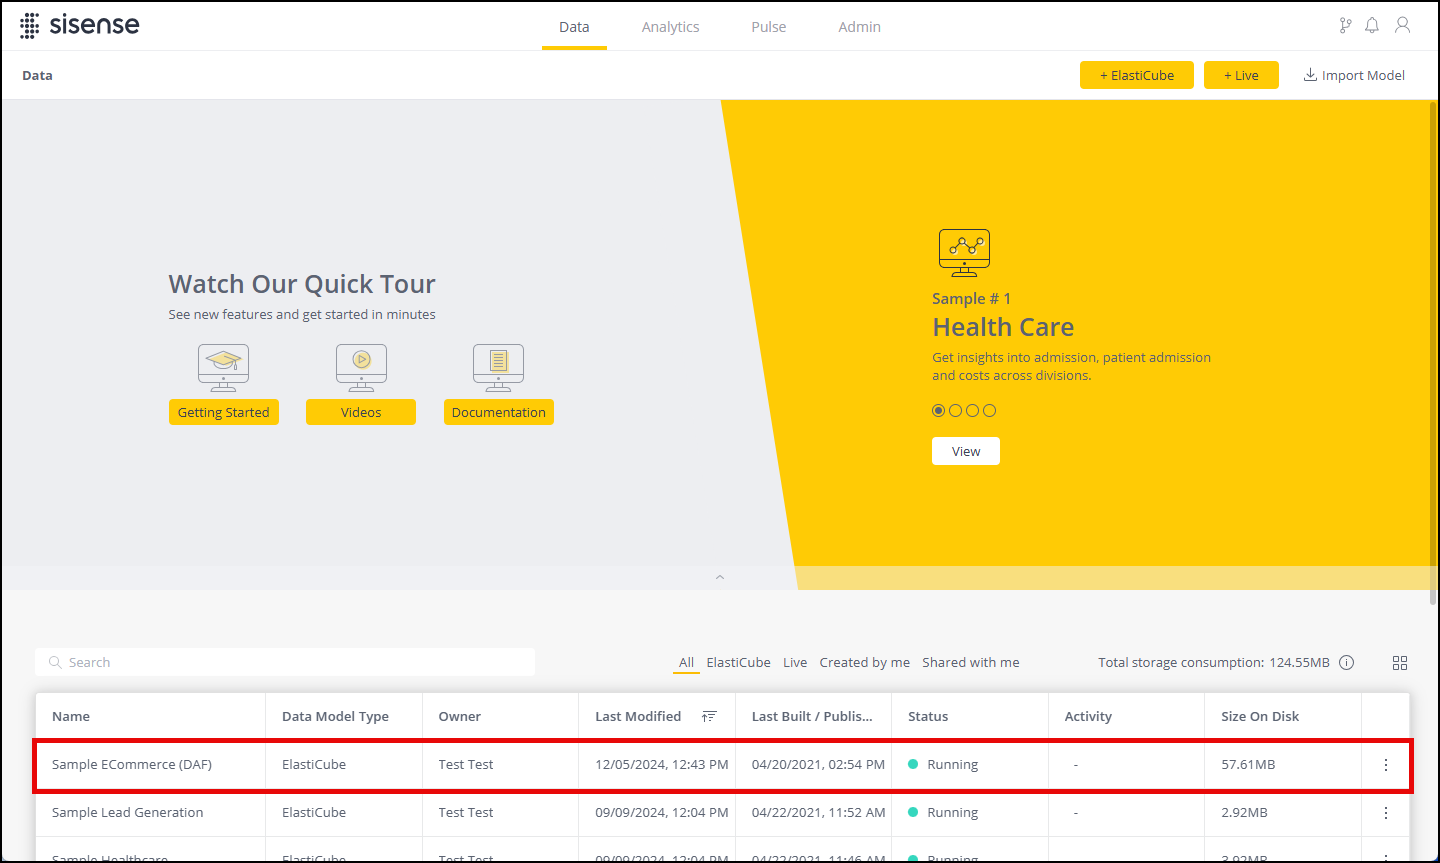
This brings you to the Data window displaying your database layout.
-
Select one of the two ways to present the data using the
 button.
 -
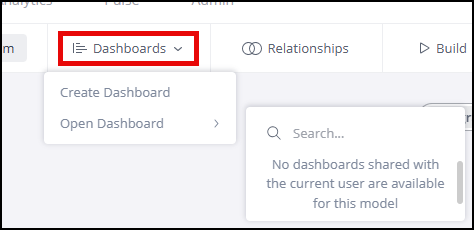
Click Dashboards:
-
From the drop-down list, choose Create Dashboard. You are presented with the following window:
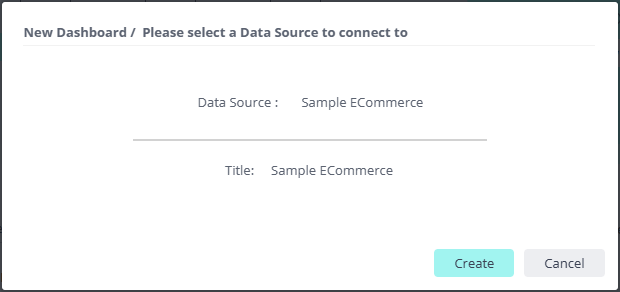
The default Data Source is the one you chose earlier (you can change it if you need to bring in another data source). A default dashboard title is opened, which you can change.
-
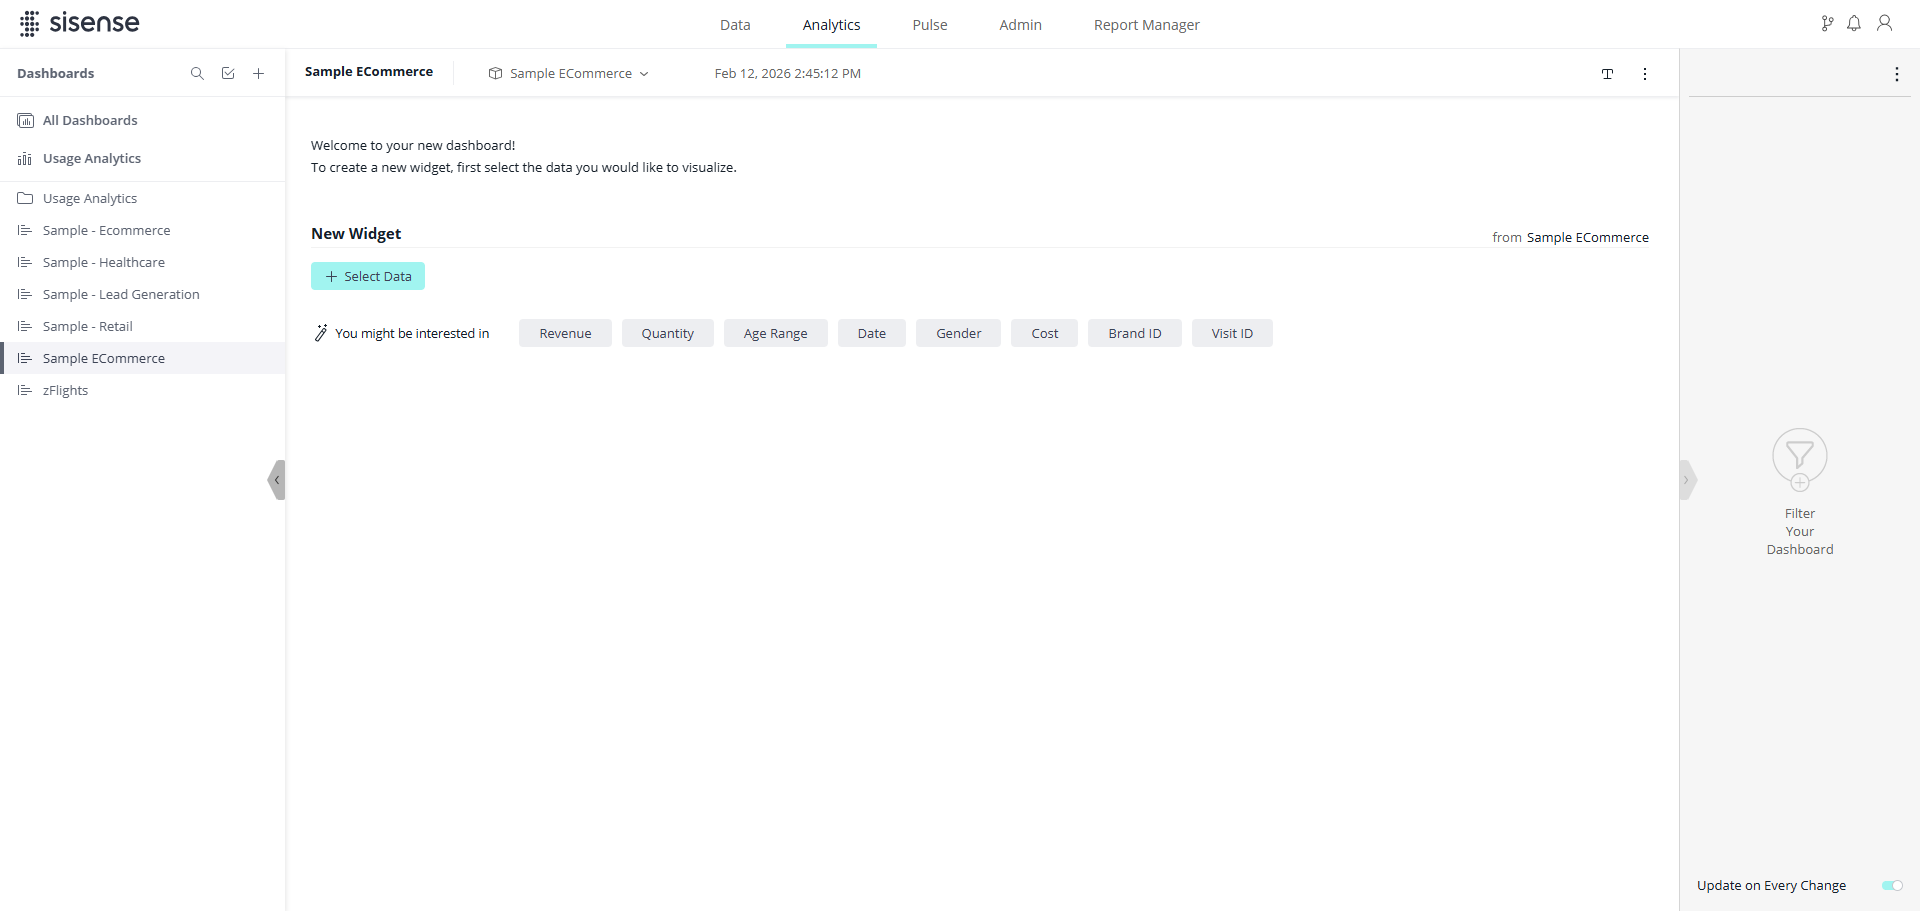
For now, accept the defaults and click Create. An empty dashboard is displayed:
-
Click
 .
. You are presented with a list of tables and their constituent columns fields.
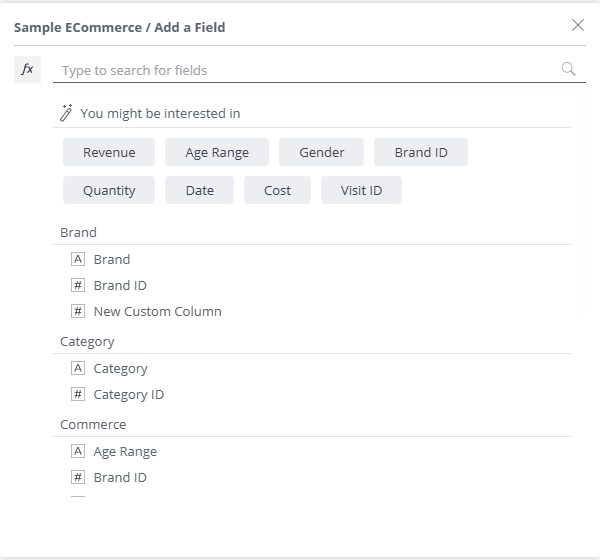
Notice that alongside each column heading there is an icon indicating the data type.
-
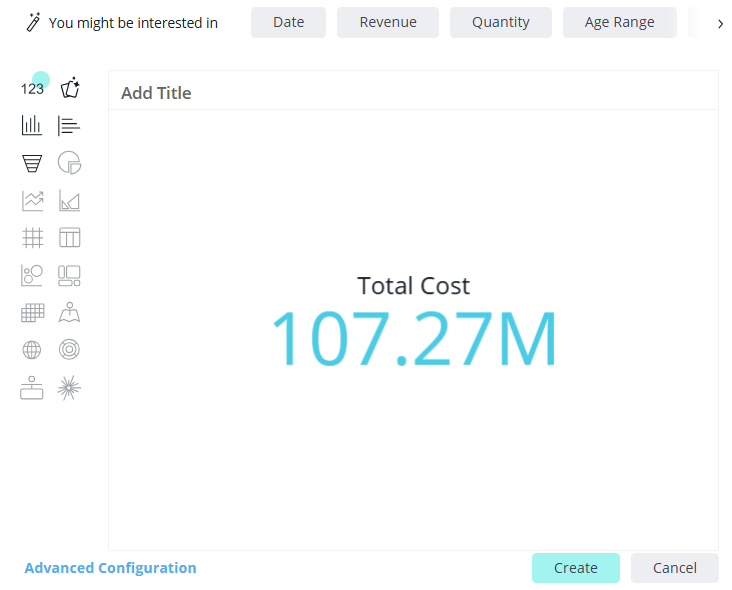
In the Commerce table, choose Cost. The center part of the display shows the aggregate cost (all items, all locations, etc).
-
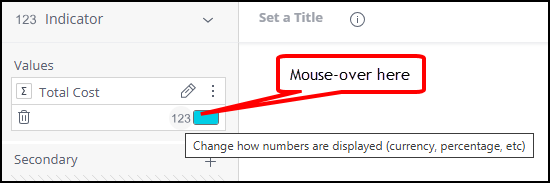
At the bottom-left of the window, click Advanced Configuration. This opens widget formatting functions.
To the left you will see widget field formatting functions. These items offer mouse-over functionality as shown in the right-hand image below:
-
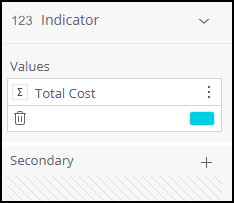
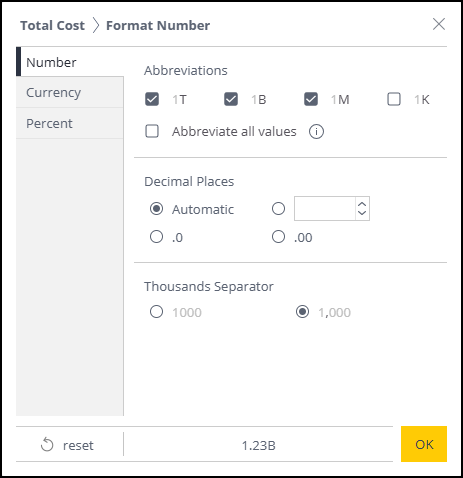
Click 123 to open a number formatting window:
-
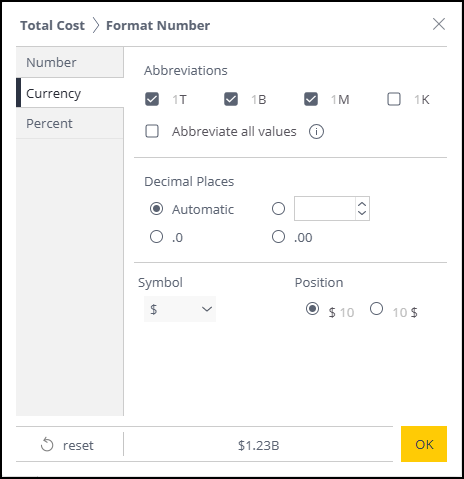
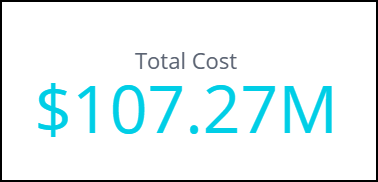
Choose Currency and click OK:
Here is the outcome:
-
Overwrite the top left Set a Title area with a title of your choice and click
 .
.Your dashboard now has one widget:
Tip:
The above procedure is typical of formatting a widget field. If some property that you need seems to be missing, mouse-over the items in the left and right formatting windows and you will find it!
The Cost widget is very simple. Let us set up a widget showing total cost by location. Click  .
.
Once again, you are shown the New Widget window. Click .
Once again, from the list of fields, choose Cost.
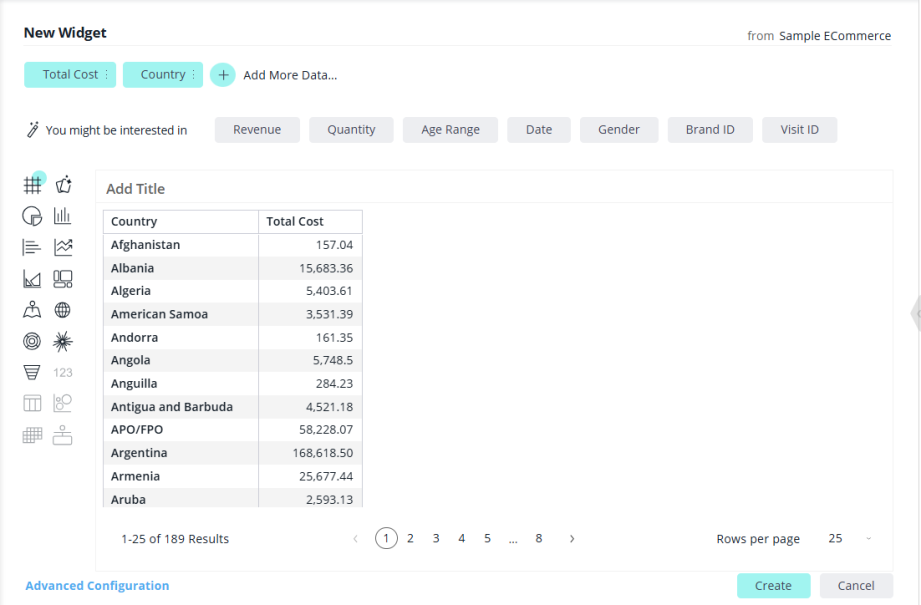
To display the total cost by location, click Add More Data. The previous list is displayed. Choose Country. You are presented with a table showing a cost breakdown by country:
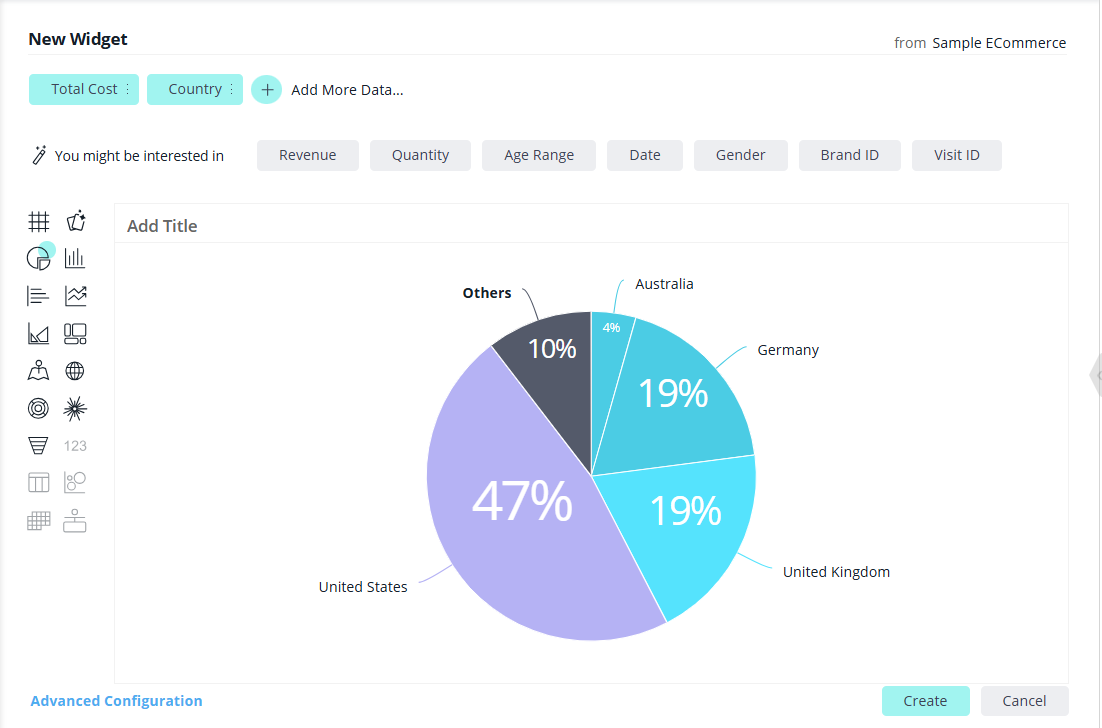
On the left there is a column of icons indicating display styles with the table item selected. Click the pie chart icon  . Here is the result:
You can fine-tune the chart by using Advanced Configuration:
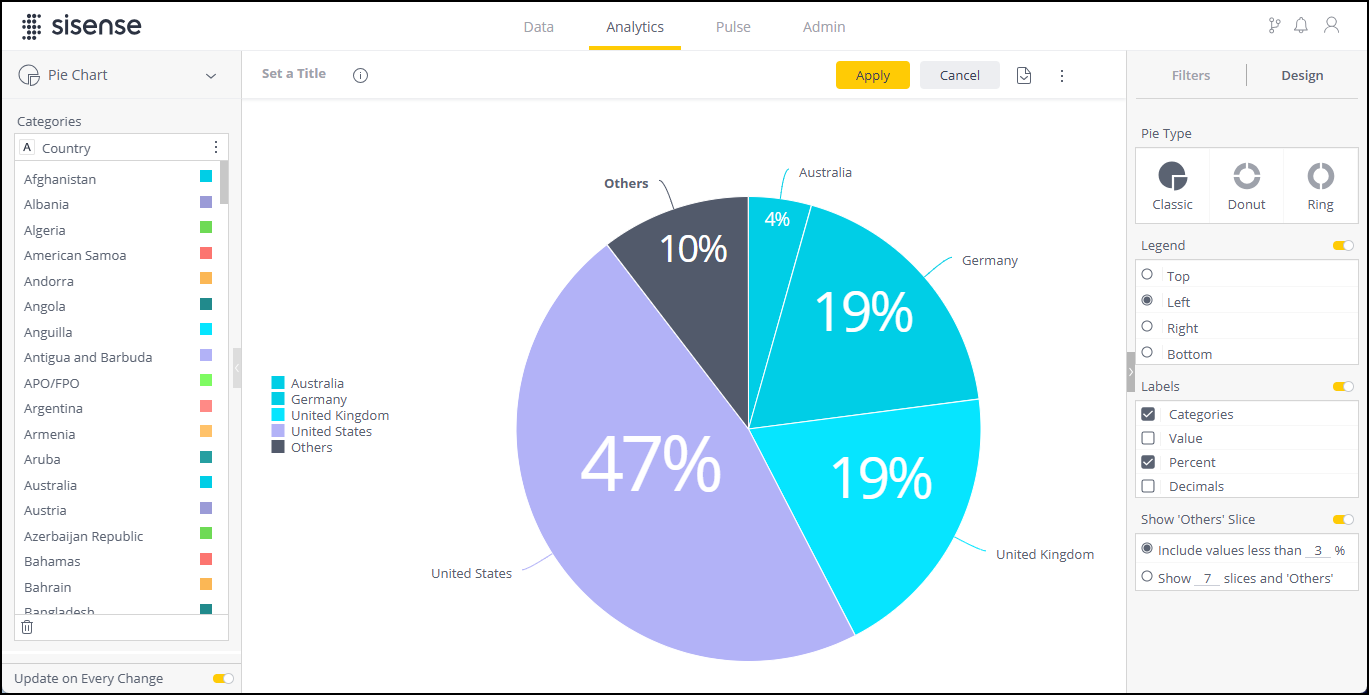
Select the following:
-
Pie Type: Donut
-
Labels: Check Value
Finally, click Apply. Here is the outcome:
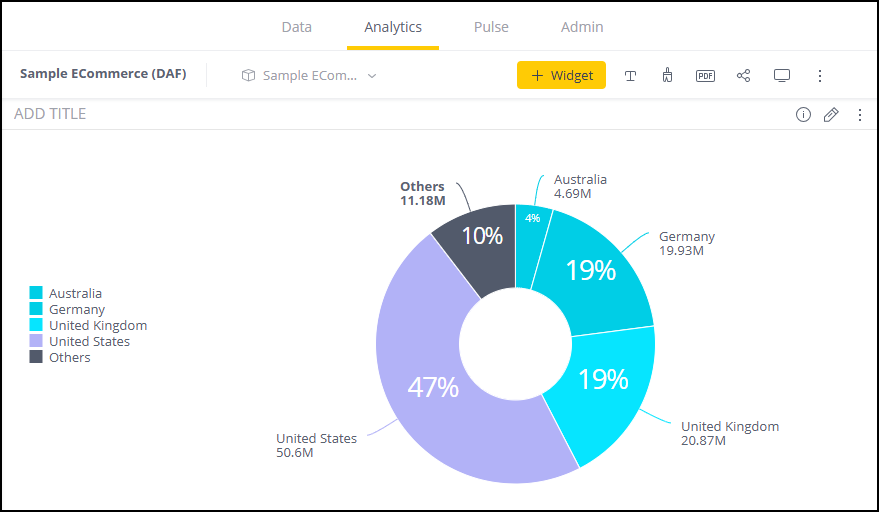
There is a little more to do:
In the ADD TITLE area, add a title, for example: Cost by Country.
If you want to further edit the chart, click the pencil icon (near the top left). We moved the left hand legend to the right. (See the next figure below.)
There is no explicit Save required. Your work is updated dynamically.
That’s it!
Finishing touches
To round out this quick guide, we will add several more widgets without going into all the details so that we have a real dashboard.
Here it is:
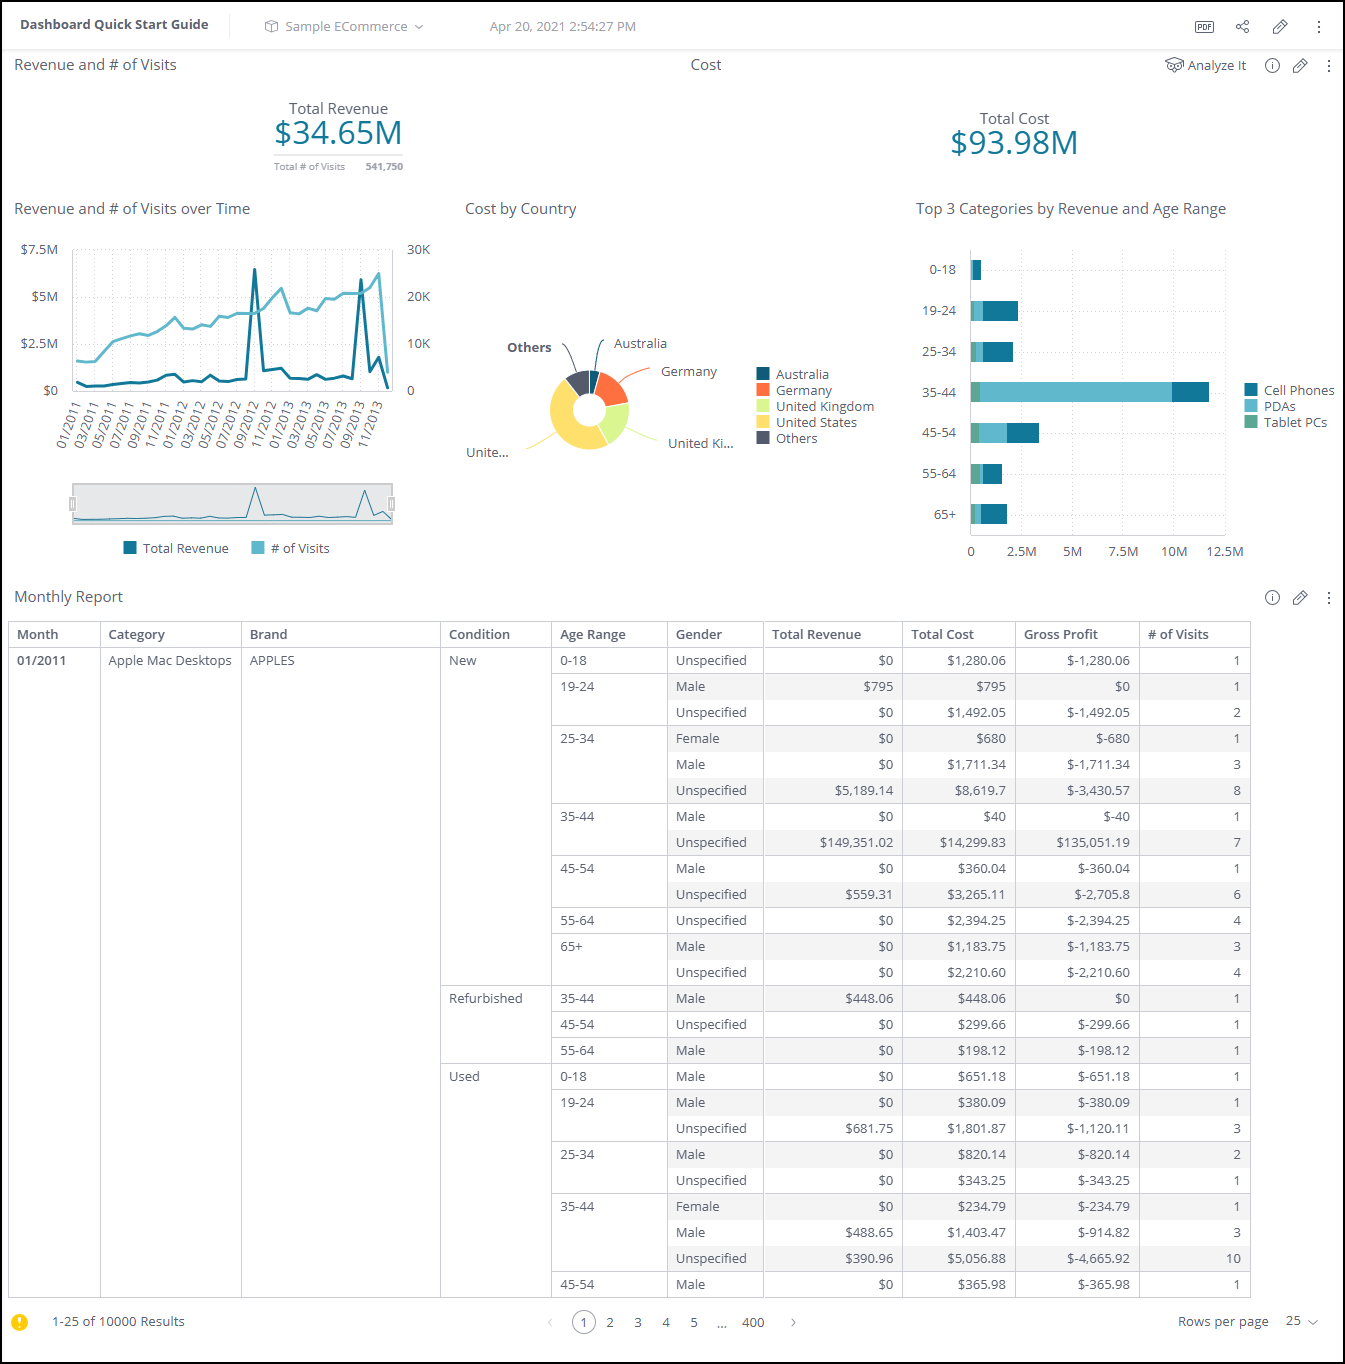
Note
Notice that we moved and re-sized the widgets by dragging them by their title bars and grabbing and dragging their borders.
Best Practices
-
Usually you will not create a dashboard from a general data model but from a Perspectives. Perspectives are sub-models set up for specific audiences such as Sales, Customers, HR, Accounting.
-
We recommend the inverted pyramid approach for laying out the dashboard content, which means the most important / high-level information should be placed at the top, usually in the form of indicator widgets, followed by the contextual information (pie/column/bar/line charts). Last comes the lowest-level details such as Pivot Tables.
-
For a detailed look at Best Practices, take a look at Dashboard design best practices – 4 key principles.
Next steps
-
For each widget in the dashboard you just created or one of the supplied samples, explore the available widget editing options
-
Take a look at the Introduction to Dashboards referred to above
-
Most important: Try it with your own database!