Sisense Basic Concepts and Terminology
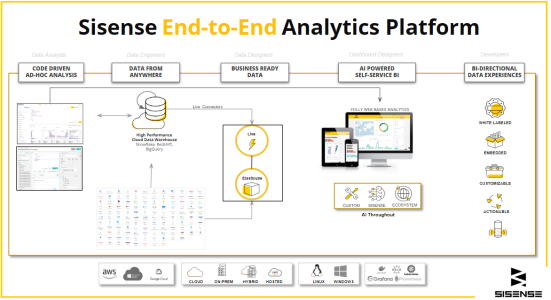
Sisense High-level Architecture
The Sisense system is comprised of the following components.

Data Sources
Data models may be files or databases located on servers on a local network, or remote locations and web services. Sisense supports a variety of data sources, among which:
- High Performance databases such as Snowflake, Redshift, Big Query
- Traditional relational databases, such as SQL Server, MySQL or Oracle
- Online web services, such as Salesforce.com, Google AdWords, Google Analytics, Zendesk and more
- File-based data sources, such as spreadsheets (Excel) and CSV files
These sources are supported through native connectors, customer REST connectors, and JDBC drivers, that are used to import data into the ElastiCube Server.
ElastiCube Data Hub
The ElastiCube Data Hub allows you to easily integrate data from multiple disparate data sources into a single source of truth, and enable viewing both near real-time and historical data from your sources.
The ElastiCube Data Hub provides the ability to deliver on your organization’s analytics strategy even when changes occur to underlying source systems. This includes not waiting for completion of data warehousing projects to perform analysis. The data model can easily be adapted to changes in the underlying data architecture by easily reconnecting to changing sources systems ensuring continuity. Working with the ElastiCube Data Hub, you can fully utilize data from across your organization to ensure that you are seeing the full picture.
Data models are abstract entities that organize your data and determine how your tables relate to one another. Sisense has two types of models, Live models and ElastiCube models. Which model you use depends on how you connect to your data source. If you want to run queries directly against the data source, you will use a Live model. If you are importing your data into Sisense, you will use an ElastiCube model.
Live and ElastiCubes models are created and managed from the Data page. Both are described in more detail below.
Live Models
Live models are a type of data model used to manage the schema over your Live data source. Live connections are useful for getting near real-time updates, with changes in your data reflected in your dashboard. For more information, see Live Connect.
ElastiCube Models
ElastiCube are Sisense’s proprietary super-fast data stores. ElastiCube s are specifically designed to withstand the extensive querying typically required by business intelligence applications.
ElastiCubes are based on Sisense’s proprietary In-Chip technology, which leverages the Sisense engine. Read more about the technology behind ElastiCube in Sisense's technology section.
ElastiCube models can run on-prem or they can be deployed on any cloud, private or vendor-managed, or on a hybrid combination of on-premises private cloud and public cloud services.
Front End Apps
Sisense Application Server
The Sisense Application Server is installed locally on your computer and hosts the Sisense Web Application. It provides access to Sisense dashboards and Sisense Admin screens for user management.
ElastiCube Server
The ElastiCube Server is installed locally on your computer and enables access to ElastiCubes. The Sisense Web Application queries the ElastiCube Server and receives results.
Sisense Web Application
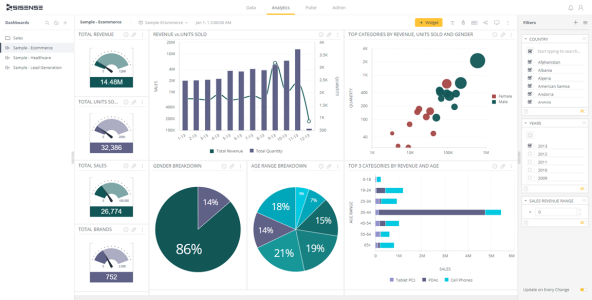
The Sisense Web application is an interactive web application that provides the user interface in which users can design, share, view and explore dashboards. The Sisense Web application runs in popular web browsers and enables access to the Sisense Application server. Dashboards can also be viewed on mobile devices.
Widgets
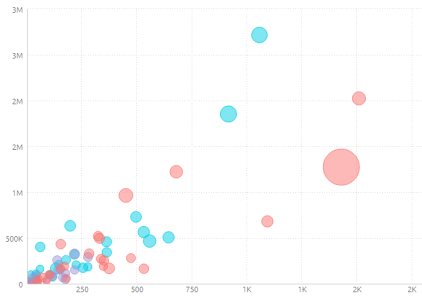
Each widget is a dynamic visualization of data. You pick the type of data to appear in a widget and you pick the type of visualization (chart type). A few examples of widgets are displayed below:
| Column Chart Widget | Indicator Widget | Scatter Chart Widget |

|

|
|
To learn more about the different widget types, click Widget Designer.
Dashboards
A dashboard is a collection of one or more widgets that visualize the data that you select and design.

You define which widgets appear in the dashboard, their design, how they are organized and the filtering of the data that appears.
You can access your own dashboards and dashboards others shared with you.
Sisense allows you to create as many dashboards as you need. No limitations! When you create a dashboard, you are the dashboard’s owner. Owners can share dashboards that they have created with other Sisense users.
Sisense provides a variety of built-in automatic dashboard sharing features. You can easily share a dashboard with others in the Sisense environment or have a dashboard automatically delivered to your chosen recipients by email (on a scheduled basis or upon each data update).
Fields
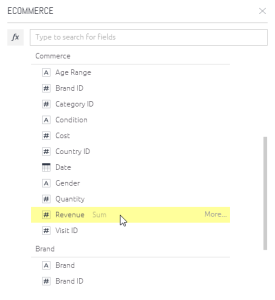
Widgets are composed of fields that represent the data in your data sources. You create widgets by simply selecting from the fields displayed in a Data Browser, which appears in various places across the product. Each field represents a column of data in the ElastiCube.

When designing widgets, fields can be categorized into three groups:
- Numeric Fields : Numbers (quantified data), such as salaries, sales, scores, number of clicks and so on. This is data that you may want to aggregate or calculate. For example, the sum of sales or the average of costs.
- Date Fields : Dates can describe both date and time values. Dates can be used to organize your data into hierarchies according to year, quarter, and month or into buckets of time such as by hour or by 15-minute intervals. For more information, see Date and Time Fields.
- Descriptive Fields : Items used to label and categorize, such as Products, Locations, Categories and so on.
Generally, widgets combine both these types of fields. For example, to show the sales of a product over time, Sales is the numeric data and both Products and Time are descriptive data.
Descriptive data can be considered as numeric when it is simply a count of the number of items. For example, Activities can be considered numeric when it is a count of the number of Activities. A number can be considered as descriptive when it is an actual entity. For example, an identification ID or phone number.
For information regarding Sisense internals and a more advanced explanation of the Sisense architecture, click Sisense Architecture.
.r.
