Replacing Missing Values with Zeros
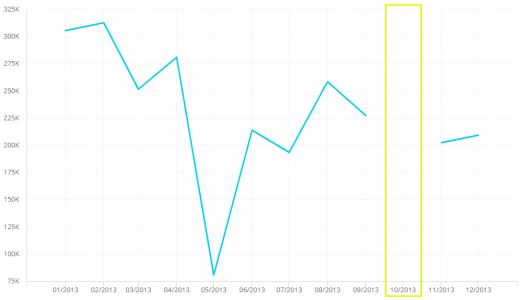
If your data includes null values associated with a date, this can lead to gaps in widgets that are based on Cartesian charts.

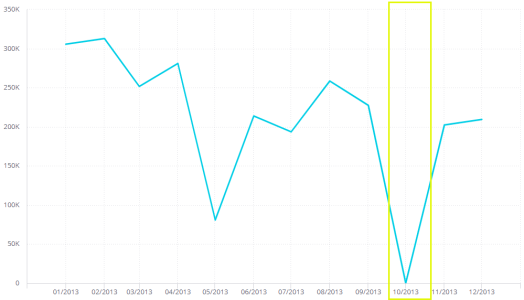
You can replace the missing values (Null) with zeros to create a continuous data flow.

For example, if your chart begins in January and ends in December, but there is no value for October, you can choose to include the missing date on the x-axis. You can also choose whether to continue the graph (create zero values) or cut the graph where there are missing values.
To replace null values as zeros:
- Create or edit a widget that is based on a Cartesian chart.
- Add data to your widget.
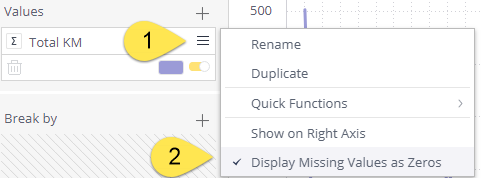
- In the Values panel, click the menu and select Display Missing Values as Zeros.

- Click Apply to save the changes to your widgets.
.r.