Creating Data Alerts
This topic describes data alerts and how you can add them to Sisense Pulse.
Data alerts are triggered by conditions you define for your widgets. For example, if you have an Indicator widget that represents your company’s revenue, you can define an alert that notifies you when this revenue reaches or falls below a certain threshold.
Sisense supports alerts for the following widgets:
- Indicator Widgets
- Area Chart Widgets
- Bar Chart Widgets
- Column Chart
- Line Chart
For each type of widget you can add to Pulse, you can monitor a single value. For example, for Column charts you can monitor a single section (value) of a column. To monitor multiple values, you can add each value you want to monitor to Pulse separately.
When creating data alerts, you define the condition that triggers the alert. Sisense provides three alert conditions that can trigger an alert:
 Threshold
Sisense notifies you when a threshold is reached following a build. This condition is useful for monitoring metrics that follow a regular, cyclical schedule.
 Automatic
Sisense automatically notifies you when the Sisense alert engine identifies an anomaly in your data based on machine learning algorithms. The Sisense algorithm actively learns from your data and eliminates noise to identify anomalies in your data. Sisense’s anomaly detection is based on a smoothing algorithm that takes the latest values into account. The more times an ElastiCube is built or a Live model is published, the more accurate Sisense becomes at identifying any anomalies and notifying you.
 Always
For widgets based on ElastiCubes, Sisense notifies you after each build, regardless if there is a change in your data or not.
In addition, you can configure advanced settings that determine who receives the alert and what channel the alert is sent through. For more information see Advanced Settings-Overview.
To create a data alert:
- For an Indicator widget, from the widget’s menu, select Add To Pulse.
For other types of widgets, right-click any value in the chart and select Add To Pulse. - The Add to Pulse window is displayed.
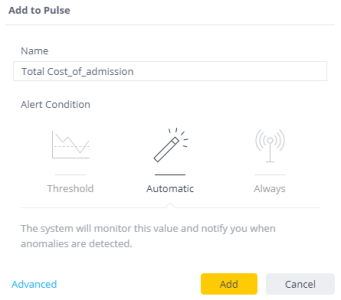
- In the Name field, enter a meaningful name that represents your alert.
- In the Alert Condition area, select the condition that triggers the alerts.
Threshold: Sisense defines the threshold value as the current value displayed in the widget. You can increase or decrease this value and define the equality and relational operators that determine when the threshold is met.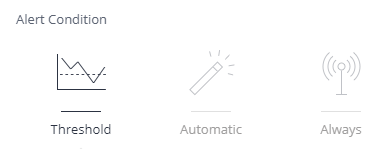
Automatic: Sisense automatically identifies anomalies in your data and alerts you.
Always: Sisense notifies you every time the data changes.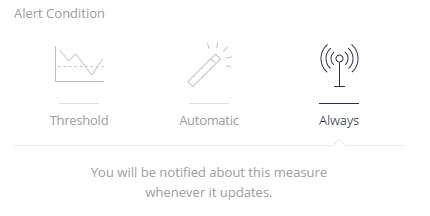
- Click Add to create the alert. The alert is added to Sisense Pulse.
For additional advanced configuration options, see Advanced Settings-Overview.
Customizing the Frequency for a Data Alert (Widget Level)
When you add a Pulse for a data point on a widget connected to a live data model, the following appears:1.png)
- Enter a name for the alert.
Give the alert a meaningful name that will enable others to identify a live-based Pulse compared to an ElastiCube-based Pulse.1.png)
- Select an Alert Condition (see above for details).
- Set the Alert Frequency. You can configure Sisense to check if the alert condition is met every x minutes, hours, or days, and send an alert, if required.
Notes:
- If you select “Days”, you will be prompted to set a time of day for the alert to be sent.
- For all options, you must enter a natural number. For example, “1” or “2”, but not “1.5” or “2.5”.
When you add a new data alert, it is no longer connected in any way to the original widget from which it was added. A separate entity and query for this Pulse is saved in the system.
Editing a Data Alert for Live Data Models
Edit live-based pulses in the same way as you edit any other Pulse. When you edit a live-based Pulse, you can also change the frequency1.png)
.r.