Changing a Widget’s Visualization
You can change the visualization of a widget (for example, from a Line Chart to a Pie Chart). When you change the type, all relevant values and definitions are transferred to the new visualization.
To change a widget’s visualization:
-
Open the Widget Designer, as described in Widget Designer.
-
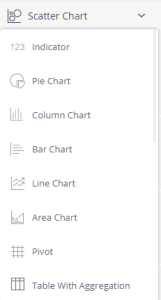
Click the Visualization selector, shown below, to display a menu of visualization options.

-
Select a different visualization, and click Apply.
.r.