Analyzing Trends in Your Data
Sisense enables you to add trend lines and apply advanced analytic models over a widget to highlight tendencies in your data and get insights quickly.

Sisense supports trend lines on all Column, Line, Area, and Bar charts. For any relevant widget, the Analyze It icon is displayed in the widget’s menu.
Note:
If you're currently using the Forecast add-on for trend lines, perform the steps detailed in the section below, Migrating from the Forecasting Add-on, before using trend lines in your dashboard.
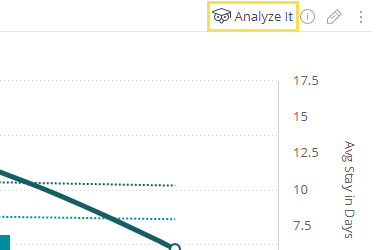
Both Dashboard Designers and Viewers can interact with this icon to apply trend lines.
-
Click Analyze It and then select Trend.
-
Select the value that is analyzed by Sisense (if more than one value is displayed on the widget).
-
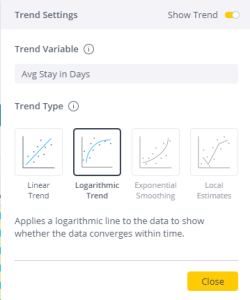
Define the trend settings.
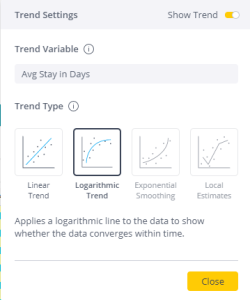
Sisense supports four different trend types.
Linear Trend: A linear trend line is a straight line that usually shows when values are increasing or decreasing at a steady rate.
Logarithmic Trend: A logarithmic trend line is a best-fit curved line that is used when the rate of change in the data increases or decreases quickly and then levels out.
Exponential Smoothing: An exponential trend line is a curved line that is most useful when data values rise or fall at increasingly higher rates. You cannot create an exponential trend line if your data contains zero or negative values. Sisense averages two spline regressors to reduce the noise in a time series when calculating this type of trend.
Local Estimates: Local Estimate models add trend lines according to the mean of a time series.
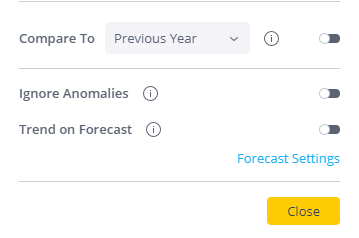
In addition, from the Trend Settings window, you can:
- Compare data to previous time periods : Select to add another trend line based on data from the previous time period you select.
- Ignore anomalies: Select to ignore data points that differ significantly from the majority of the data, e.g. Sales peak on ‘Black Friday’. These points are replaced with the average of the two adjacent points (before and after the detected anomaly
- Add trend lines to forecast: Select to add a trend line not just to your historical data, but also to forecasted results. For more information, see Forecasting Future Results.
Adding Trend Lines to Widgets
To add a trend line to a widget:
-
In the Sisense dashboard, click Analyze It on the relevant widget’s menu.
-
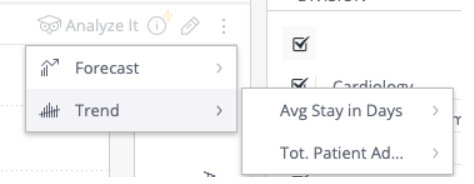
Select Trend and then the relevant value.
-
Enable Show Trend if it is disabled. If it is already enabled, select Trend Settings.
-
Select the trend type. Only supported trend types are enabled. If your data does not support a trend type, you cannot select it. The trend line is added to your widget.
-
Click Close.
Your trend line is now added to the widget. You can right-click the trend to open the Quick Settings again to make any changes.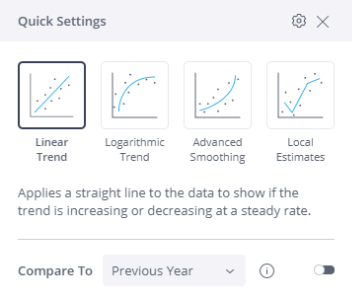
Enabling/Disabling Trend Cloud Models
There are two trend types available by default: Linear Trend and Logarithmic Trend. However, Administrators can add access to two additional trend types: Advanced Smoothing and Local Estimates. These types are not offered by default and need to be enabled by the Administrator on the Admin page because they require cloud access.
Note:
Disabling Trend Cloud Models does not turn off the whole trend feature. Disabling this feature turns off Advanced Smoothing and Local Estimates, which require cloud access.
In the Admin page, under Feature Management, toggle the Trend Cloud Models switch to enable or disable the Exponential Smoothing and Local Estimates trend types.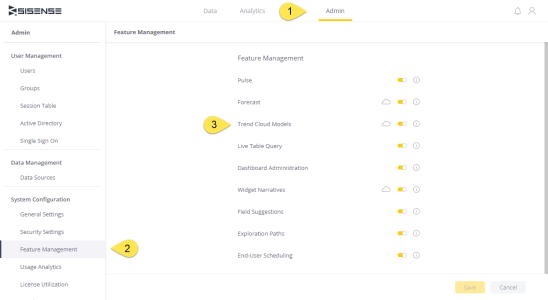
Migrating from the Forecasting Add-on
If you're using the Forecasting add-on for trend lines, perform the following steps to switch to using native Forecasting and trend lines in Sisense :
- Disable the Forecasting add-on. For more information, see Sisense Add-ons. This removes the Forecast and Trend lines from any widgets on which the add-on was applied.
- Add trends to any relevant widget.
Limitations
- Sisense is limited to calculating numbers greater than 16 digits, which can either be an integer (whole number) or a real number with a floating point. Data returned in widgets and table previews display values rounded up to 16th digit.
- Only Cartesian charts are supported, Column, Line, Area, and Bar charts
- Only time series with a single date dimension are supported
- Break by is not supported
- Exponential Smoothing and Local Estimates require at least 30 data points to run
- Null values may disrupt the models' calculations
.r.