Table
Last updated: June 11, 2026
| Tier | Deployment |
|
|
|
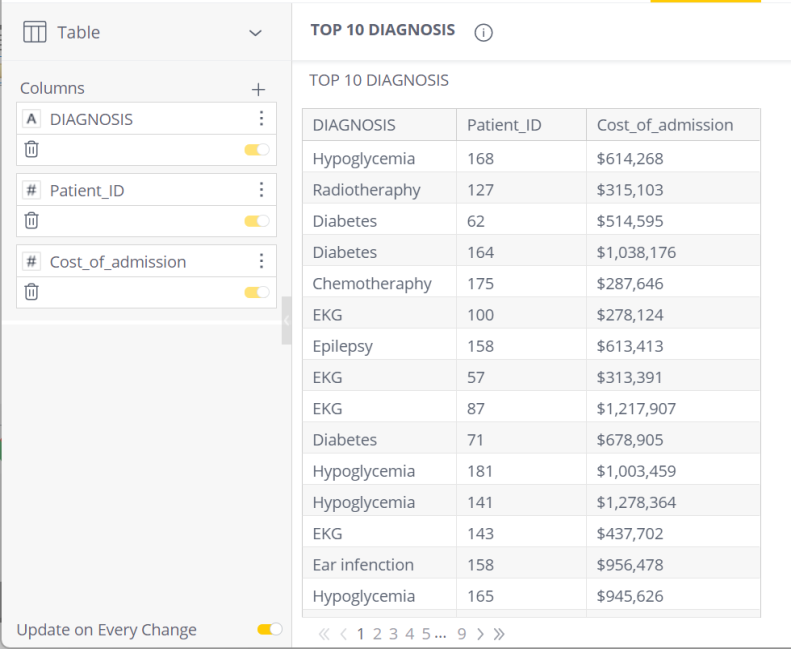
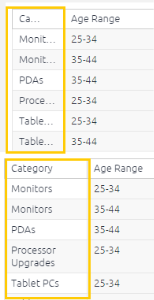
The Table widget displays a broader view of your data, presenting it in columns, with as many fields and as much metrics as necessary, tailored to your needs:
-
as raw and non-aggregated data
-
as aggregated values, with available aggregations depending on the data type
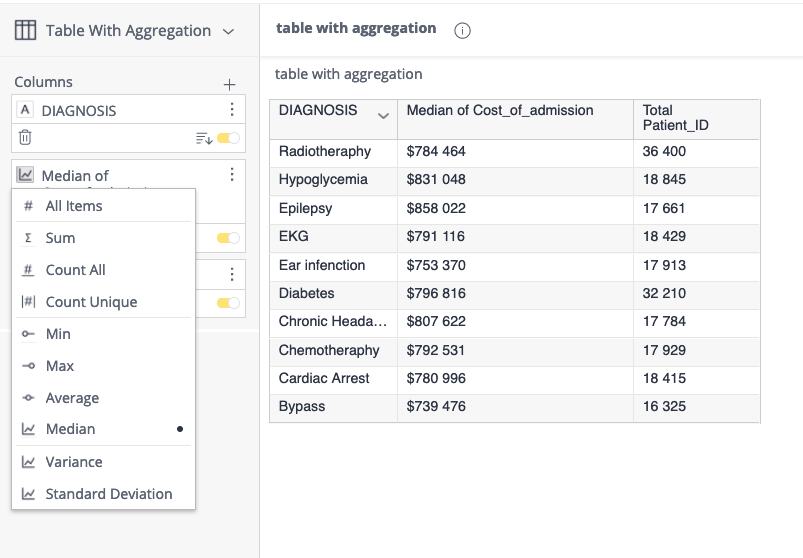
Note:
-
The 'All items' option returns all records (not distinct values).
-
The rows and columns have the following predefined limits which can be changed in the base configuration settings - contact your CSM if you require help with this:
-
For performance reasons, the default maximum number of data columns is limited to 20.
-
The row limit for the majority of widgets is defined by the query limit, except for Pivot widgets, which has its own settings.
-
For a short video overview of the table widget, see below:
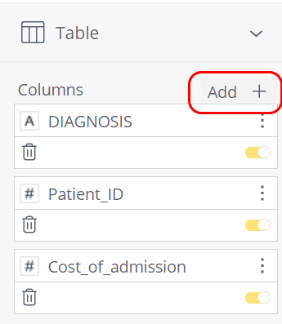
Adding Data
-
Click Add + to select the field(s) that you want to add to the table.
To rearrange the order of the columns, click and drag a column up or down.
Designing the Table Panel
Fine-tune the appearance of the Table widget, using the following tools:
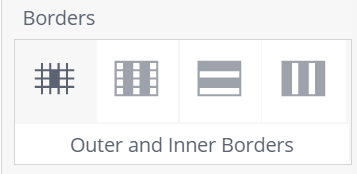
-
Borders: Select the borders to display in the table.
-
Column Width: You can resize the column widths as follows:
- Fit to Window Size: Columns are resized automatically to fit the contents in the window.
- Fit to Content: You can manually resize the column widths by dragging the column separator.
-
Colors: Select whether to color (highlight) alternating columns and rows, and the table header.
-
Word Wrap: Select whether to wrap texts in headers and rows.
Note:
Enabling word wrap in rows might increase the total number of pages in the exported file and, in turn, increase memory consumption in the exporting pod by approximately 20%. This may affect the export process. Consider increasing the limits.memory setting for the exporting pod. If the issues persists, please contact Sisense Support.
-
Infinite Scroll: Toggle the Infinite Scroll option On or Off:
- On: Include all items in a single page with scrolling. Additional data loads as you scroll down in the page.
- Off: (Default) Specify how many rows you want in a single page. Paging options are displayed above the specified number.
Limitations
-
The >> and << icons shifts by 8 pages at a time.