Sisense Quest Custom Models
In addition to models defined by Sisense, you can add Python code and libraries to create your own custom models that can be applied to widgets.
There are several steps to creating a custom model. The first step is to create a Python script that defines your model's functionality. Once you have created the script, you can test it locally on your machine with data from Sisense . In the Quest Model Editor, click to download a JSON file of your widget's data (this is the format of the data you should expect to get as input in your script).

For example, if you have a specific widget that you want to add a model to, you can open that widget in the Sisense Quest Model Editor and download its data in JSON. This allows you to test how your model will work when applied to real data.
Data format:
{
"data": [
{
"name": "",
"datatype": "",
"level": "",
"values": [...]
},
...
]
}
The input data is represented in a JSON format. Each column in the data is represented as an item in JSON. The name property is the name of the column, the datatype property is the data type of the column (date, text, numeric). When the datatype is date, the level property will be the level of the data (days, weeks, months, quarters, years).
When the datatype is not date, the level will be empty. The values property is a list of the values of the column.
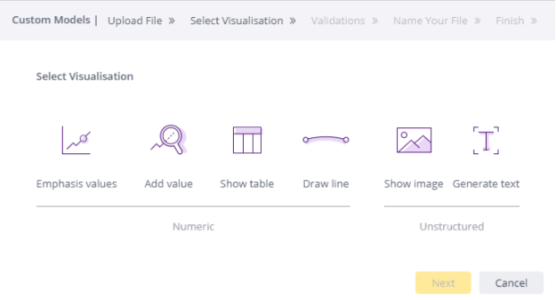
After creating your script, you upload it to Sisense. You now need to select the visualization that will be
added on top of the widget when your model is applied.

Sisense supports the following visualizations:
Emphasis Values
This model highlights points on a widget similar to the Anomaly model.
Expected data format output:
A list of the x-axis points that will be emphasized.
["2012-11-22","2012-11-29","2012-12-06","2013-11-21"]
Add Value
This model adds points to a widget based on the given analysis. The added values are going to be presented at the end of the existing series of the widget, assuming fixed intervals.
Data format output:
JSON with 3 properties:
-
"y": - A list of the y-axis values of the new series
-
"yl": (optional) - You can also add error bounds to your points. This property holds the values of the lower bounds.
-
"yu": (optional) - You can also add error bounds to your points. This property holds the values of the upper bounds.
{
 "y": [
  133503.0112,
  325576.9327,
  541408.5304
 ],
 "yl": [
  -5465.3043,
  -727129.8554,
  96291.051
 ],
 "yu": [
  208115.5237,
  4524943.7562,
  4176946.9082
 ]
}
Draw Line
This model displays a line on the widget based on the given analysis.
Expected data format output:
A list of y-axis values. The new line x-axis values are assumed to be the same as of the original widget. Hence, the length of the list should be similar to the # of points of the original widget. If the length is different, the points are added starting from the first point of the widget.
from sisense import pandas as pd
import datetime
import json

def main(event, context):
window_size = 5

# Format JSON into data frame for easy manipulation
data = event['data']
df = pd.DataFrame()
col_names = []

for col in data:
if col['datatype'] == "numeric":
df[col['name']] = col['values']
col_names.append(col['name'])

# Calculate rolling average
df["rolling"] = df[col_names[0]].rolling(window_size).mean()

# Return output in JSON
dict_output = df.to_dict(orient='list')

# Nesting the output so there is a y inside the rolling output, similar to the JSON output sent over
rolling = []
for key in dict_output:
if (key == 'rolling'):
rolling.append(dict_output[key])

print('Final JSON output')
rolling = [0] * (window_size - 1) + rolling[0][window_size:]
return rolling
Show Table
This model displays a table based on the given analysis.
Expected Data format output:
A JSON representing the table. Each item of the json represents a row in the table. The properties of the items should include key value pairs when the key represent the name of the header of a column and the value represent the value of the column in the row.
If you want to output a pandas dataframe, you can use the to_json method (with orient ='records') to convert it to the expected format.
For Example: df.to_json(orient ='records')
       from sisense import pandas as pd
       def main(event, context):
       # Format JSON into data frame for easy manipulation
       data = event['data']
       df = pd.DataFrame()

       for col in data:
       df[col['name']] = col['values']

       summary_df = df.describe(include='all').reset_index().rename(columns={'index':'Statistic'})
       return summary_df.to_json(orient ='records')
Show Image
This model generates an image based on the given analysis.
User should return base 64 representation of the image, if you want, you can use the following function. The function gets as input a matplotlib.pyplot instance by which the image was created and returns its base 64 representation
    def convert_to_base64(plt):
    """
    converts matplotlib.pyplot instance to a base 64 representation
    :param plt: a matplotlib.pyplot instance
    :return: a base 64 representation of the image
    """
    img = BytesIO()
    plt.savefig(img, transparent=True, bbox_inches='tight')
    img.seek(0)
    return "{}{}".format("data:image/png;base64,",\
base64.b64encode(img.read()).decode("UTF-8")) from sisense import pandas as pd
import datetime
import json
def main(event, context):
window_size = 5
# Format JSON into data frame for easy manipulation
data = event['data']
df = pd.DataFrame()
col_names = []
for col in data:
if col['datatype'] == "numeric":
df[col['name']] = col['values']
col_names.append(col['name'])
# Calculate rolling average
df["rolling"] = df[col_names[0]].rolling(window_size).mean()
# Return output in JSON
dict_output = df.to_dict(orient='list')
# Nesting the output so there is a y inside the rolling output, similar to the JSON output sent over
rolling = []
for key in dict_output:
if (key == 'rolling'):
rolling.append(dict_output[key])
rolling = [0] * (window_size - 1) + rolling[0][window_size:]
return rollingData format output:
"data:image/png;base64,R0lGODlhAQABAIAAAAAAAP///yH5BAEAAAAALAAAAAABAAEAAAIBRAA7"
Generate Text
This model generates and displays text based on a given analysis.
Data format output:
"Lorem ipsum dolor sit amet, consectetur adipiscing elit, sed do eiusmod tempor incididunt ut labore et dolore magna aliqua."
Once you have selected a visualization, you need to set the model's validations, these determine when a custom model can be applied to a widget. For example, if your model requires at least two dimensions and your data only has one, then your custom model is disabled. This prevents Designers from applying models to data that is not relevant for your Viewers.
Once you have uploaded your library or code, the custom model is added to your Model Editor where Designers can add them to widgets.
Sisense provides a few Python code samples you can choose from to add to your dashboards listed down below.
Adding Custom Models
To add a custom model:
-
In your dashboard, click
 for any
widget supported by Quest.
 -
In the Quest Model editor, click + Custom Models. The Custom Models box is displayed.

-
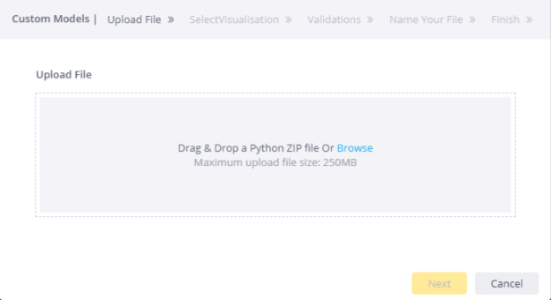
Drag your custom Python Zip file into the box.
Or
Click Browse and navigate to the Zip file.
-
Select the visualization that your model supports and click Next.
-
Under Validations, set when your model can be applied to a widget by defining the following:
-
#Dimensions - Enter the minimum and maximum number of dimensions the data must have.
-
#Date Time Dimensions - Enter the minimum and maximum number of Date Time dimensions the data must have.
-
#Measures - Enter the minimum and maximum number of measures the data must have.
-
Volume - Enter the minimum amount of data points your data must have.
Note:
Designers can view the required dimensions by hovering over the model in the Quest Model Editor.
-
-
Click Next.
-
Enter a name and a description for your model and click Next . The name is displayed in bold in the widget header and the description follows header after the '-'.

-
Click Done to add your model.