Using the Query Plan Analyzer
Running the Query Plan Analyzer
-
Ensure that the prerequisites have been met.
-
Open a dashboard.
-
Click the pencil icon of a widget
 to edit the widget.
 -
Click the widget's three-dot menu, and select Query Plan Analyzer.
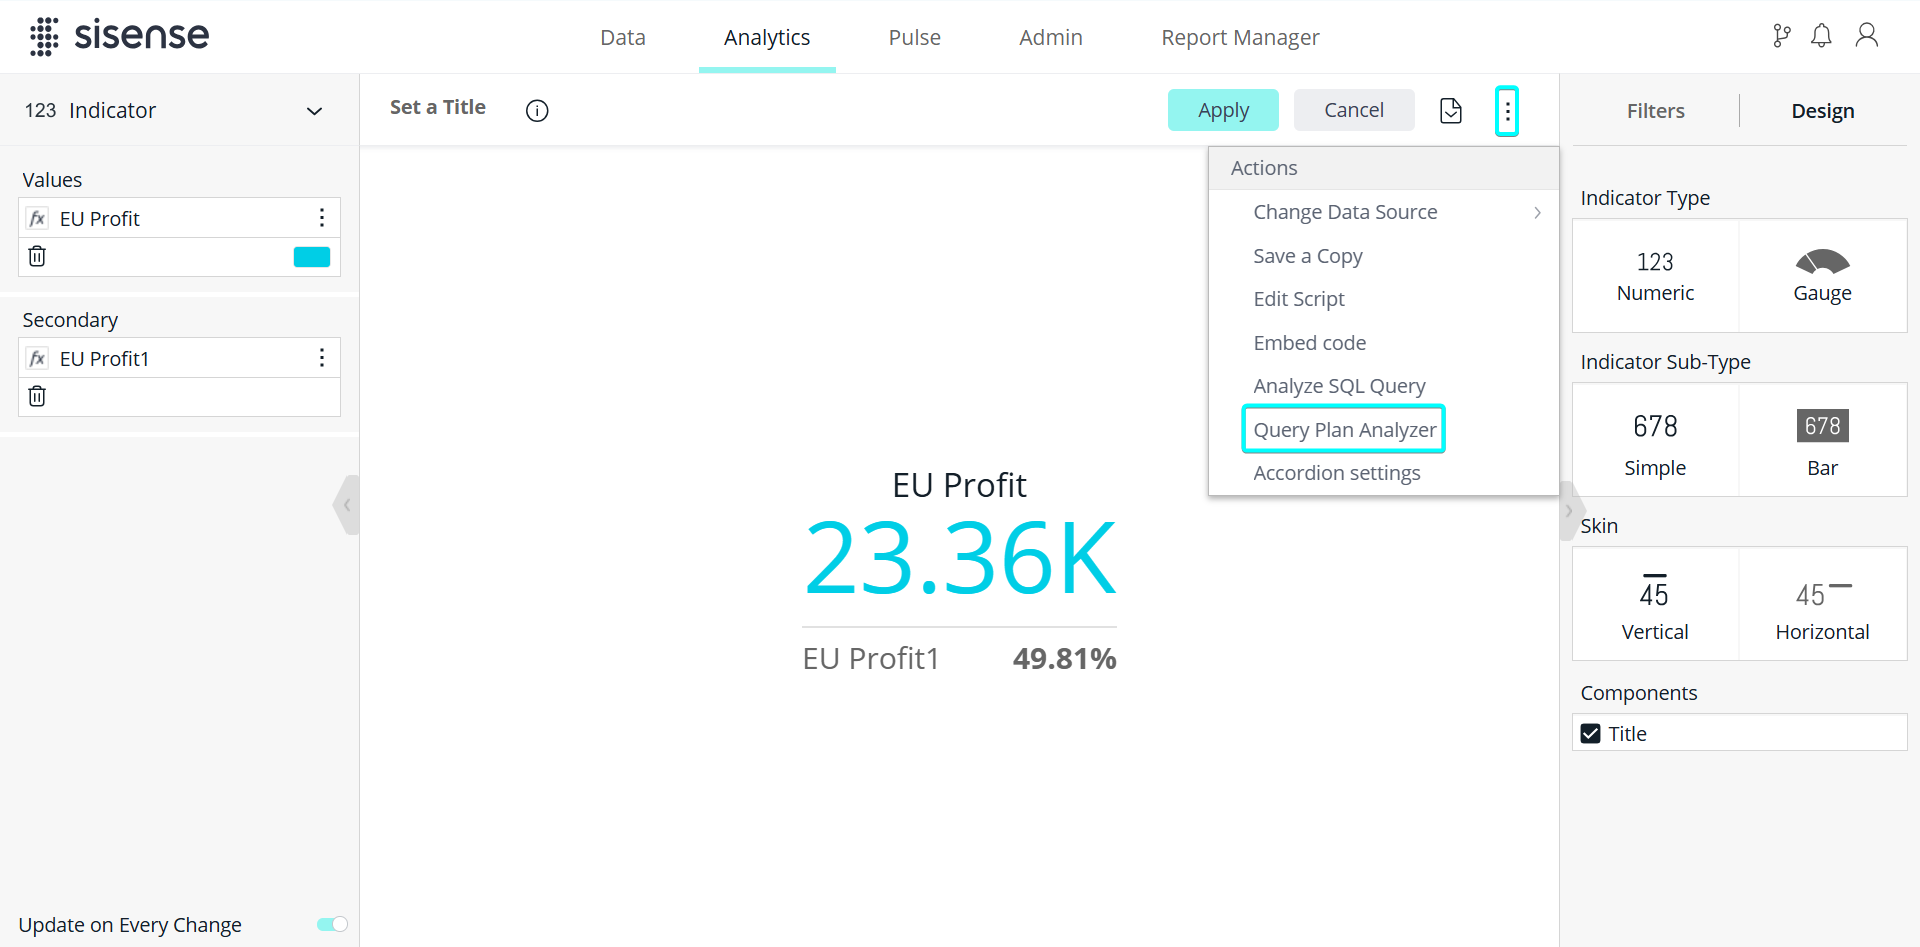
A graph such as the following is returned, presenting the logical plan of the query.

Working with the Query Plan Analyzer
The JAQLine graph is read from bottom to top to see how the SQL was created.
The Query Plan Analyzer has different types of nodes. Each node describes a different type of action in the SQL:
-
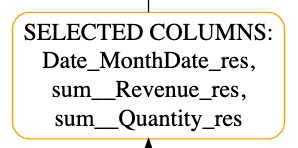
SELECTED COLUMNS: Lists all fields that were selected in the SELECT / INNER SELECT part of the query:
-
CROSS JOIN: Represents a join between two SELECT statements.
-
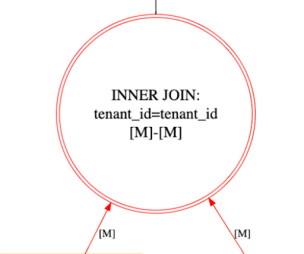
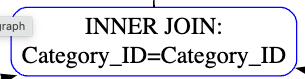
INNER JOIN: Shows an inner join between two fields based on the key of each field. Inner Join has two types: Inner joins with Many-to-Many (M2M) detection (which appears as a red circle; this makes it easy for you to recognize M2M joins between tables) and regular inner joins. INNER JOIN may have several connection types: [1]-[M], [M]-[1], [1]-[1], and [M]-[M] (represented by a red inner join node):
-
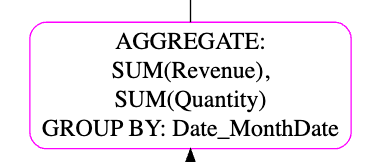
AGGREGATE: Shows an aggregation in the SQL and the GROUP BY fields:
-
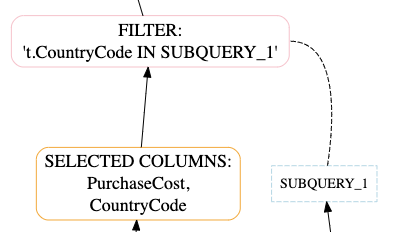
FILTER: Shows the filter in the SQL / Inner SQL based on the fields that were filtered:

-
FILTER SUB_QUERY: A filter may have another inner SELECT which represents an inner query.
For example, the following query contains an inner select:-
SELECT "Cost_of_admission"
FROM "Sample Healthcare"."Commerce"
WHERE "Room_ID" IN (SELECT "Room_ID" FROM "Sample Healthcare"."Rooms")
In the following example, the inner select is represented as SUBQUERY_1:
-
-
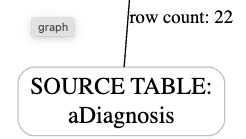
SOURCE TABLE: Lists the source table:

The Query Plan Analyzer also indicates the row count of each source table:
-
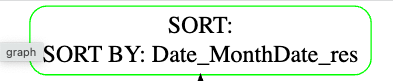
SORT: Shows the fields that the SQL was sorted by: