Editing Notebooks
If you have opened an existing Notebook, you'll see the queries that were previously entered, and the results of those queries, if the queries were run previously.
Notes:
- By default, the View SQL toggle is Off, meaning that unless a query has been run and visualizations created, no queries or blocks are displayed. To view the visualizations, toggle the button On.
- The data on which the query is based doesn't automatically update. Run the query to see the latest results.
Editing a Query
- Open an existing Notebook and click Edit Notebook.
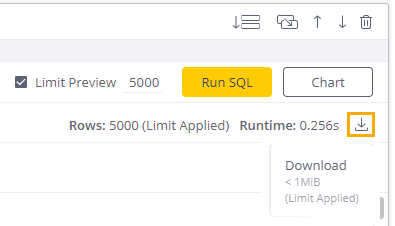
The following image represents a sample Notebooks cell.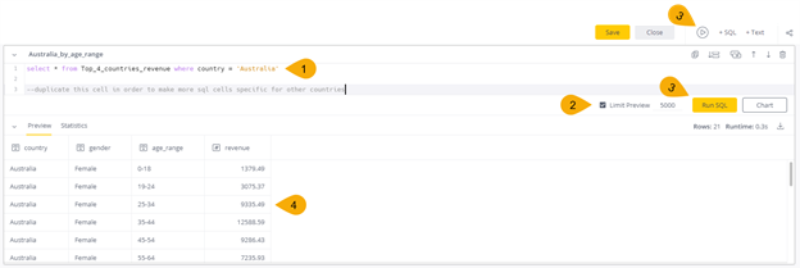
- Enter your query.
- As you type, Sisense Notebooks provides auto complete options, based on the databases, tables, and column names in the Schema Browser
- You can expand and contract items in the Schema Browser to view or hide databases and tables
- The cell automatically expands and wraps your text as you enter long queries so that you do not have to scroll
- Set the Limit Preview field to limit the number of rows that show in the results. The default is 5,000 rows.
- To view the results of your SQL query, do one of the following:
- Click to run all SQL query cells in your Notebook
- Click Run SQL to run a specific cell in your Notebook (also see Referencing Other Cells, below). A preview of the query results displays below the query.
- Click Save to save your Notebook.
Referencing Other Cells
If a single query (cell) is refreshed, it will not rerun any other cell that it depends on. Rather, it incorporates the SQL of the cell it depends on and rewrites the query in the backend to return an up-to-date result.
For example, if you have queryA which depends on queryB, the following would be the sequence of events:
- Run queryB.
- The latest version of queryA is temporarily injected into queryB.
- QueryB runs.
- The queryB cell updates, but queryA's cell does not update.
Cell Functions
You can perform various functions on a cell:
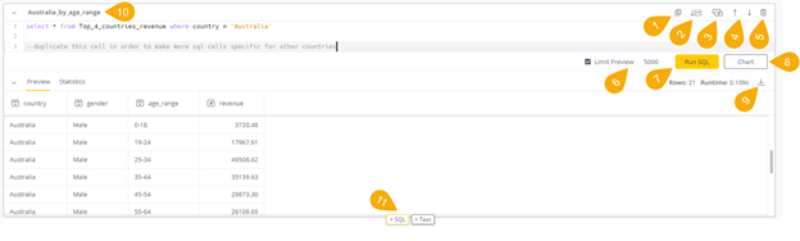
- Duplicate the cell.
- Click to break down common table expressions (CTEs) into individual cells. This uses the CTE Refactoring feature to automatically break a cell with multiple CTEs into multiple cells, so they are easier to understand and work with. For more information see Debugging CTEs, below.
- Click to reference this cell in another cell.
- Click the up and down arrows to change the position of this cell among the other cells in this Notebook.
- Click to delete the cell.
- Select to limit the number of results in the preview, and set the maximum number of rows (the default is 5,000 rows).
- Click to run this cell.
- Click to create a chart based on this cell.
- Download the results to a CSV file.
- Click and edit the name of the cell. Doing so will make it easier to refer to the query in the cell from other cells. Click the down arrow to contract the cell.
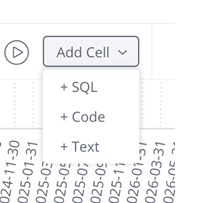
- Add new cells:
- Click + SQL to add a new cell for entering SQL queries
- Click + Code to add a code block for Python, or R
- Click + Text to add a text cell for entering free text to annotate your code
Watch this video about adding SQL cells:
Watch this video about adding text boxes:
Keyboard Shortcuts
You can use keyboard shortcuts to make working with SQL cells and text cells in Sisense Notebooks more efficient.
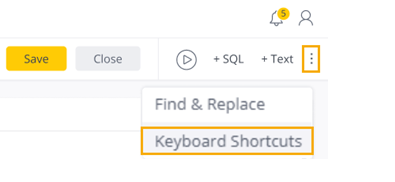
For a list of all of the available keyboard shortcuts, in a Notebook you are editing, click the menu icon in the
top-right corner and select Keyboard Shortcuts.
Common Table Expressions
Common table expressions (CTEs) create temporary result sets that you can reference within SELECT, INSERT, UPDATE, or DELETE statements.
Note:
For Notebooks, CTEs are not supported for queries to:
-
Shared ElastiCubes
-
Shared Live models
CTEs only work with direct database connections from Notebooks.
To query a Live model or ElastiCube in the Notebooks, please refer to the following documentation:
-
Supported SQL syntax: SQL Quick Reference
Debugging CTEs
Common table expressions can be very long. There is no limit on how many CTEs can be defined at the beginning of a query, as long as the database has the capacity to run them without timing out. The main problem with CTEs is that they can be difficult to debug.
Consider the following example:
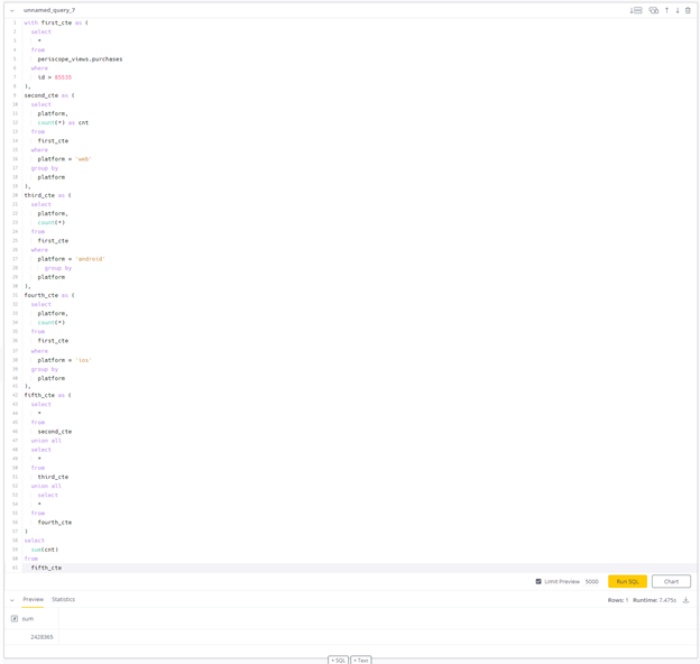
The result of this query is 1527416. However, based on other data, we happen to know that this result is too low to be correct. It is very hard to investigate the reason for this result just by looking at the query. Further debugging is required.
CTE Refactoring
The CTE Refactoring feature helps save time debugging CTEs. The first step to manually refactoring a CTE is to copy and paste each SQL statement into its own cell. CTE refactoring handles this first step automatically and, with a single click, copies each SQL statement into a separate cell. Then you can run all of the cells and investigate the results of each.
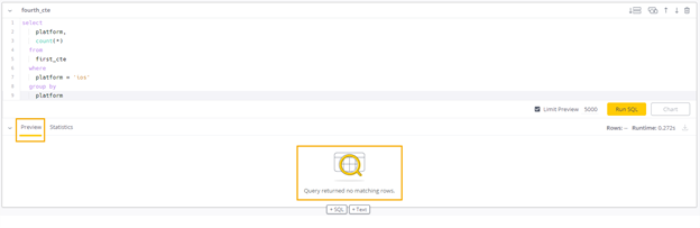
Using CTE Refactoring with the example from above, it is found that fourth_cte does not return results, (unlike the third_cte above it).
Upon closer inspection, it becomes clear that the reason for returning an empty result is that ios is case-sensitive
and should be entered as iOS, instead.
Find and Replace
You can perform a find and replace within SQL and Code blocks.
Note:
"Find and replace" only finds results in SQL and Code fields, not in text fields.
- From the menu icon in the top-right corner, select Find and Replace.
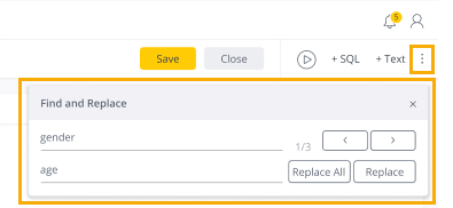
- In the Find and Replace dialog box, enter the Find term and, if required, the Replace term.
The search results are highlighted in the notebook and you can click < and > to navigate through them. A red box around the Find field indicates that no results were found.
Download Output as CSV
When you have successfully run a query, you can download the results in CSV format. The CSV file contains the entire results set up to 500MB.
To download SQL and Code Cell results as a CSV file, in the top-right of the SQL and Code Cell, click the download
icon.
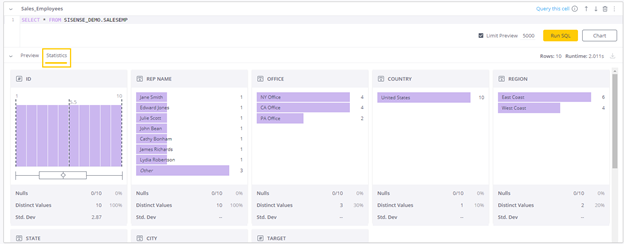
Viewing Statistics
The Statistics view in Sisense Notebooks helps data analysts to save time by automatically showing the most common statistics without having to write more SQL or wait for additional charts to load individually. This is an ad-hoc feature to help data analysts to quickly understand the query. The tab is available for both SQL and Code blocks.
To view the results of your query as statistics, click the Statistics tab.