Calendar Heatmap
Last updated: June 11, 2026
| Tier | Deployment |
|
|
|
The Calendar Heatmap widget visualizes values over days in a calendar-like view, making it easy to identify daily patterns or anomalies.
For a short video overview of calendar heatmaps, see below.
Adding Data
-
In the Date panel, select the date field that you want to be used as the calendar.
The calendar's range will be between the minimum and maximum date values within the field.
-
In the Color panel, click Add + to select the field that determines which days to color.
Designing the Heatmap
Fine-tune the appearance of the Calendar Heatmap widget, using the following tools.
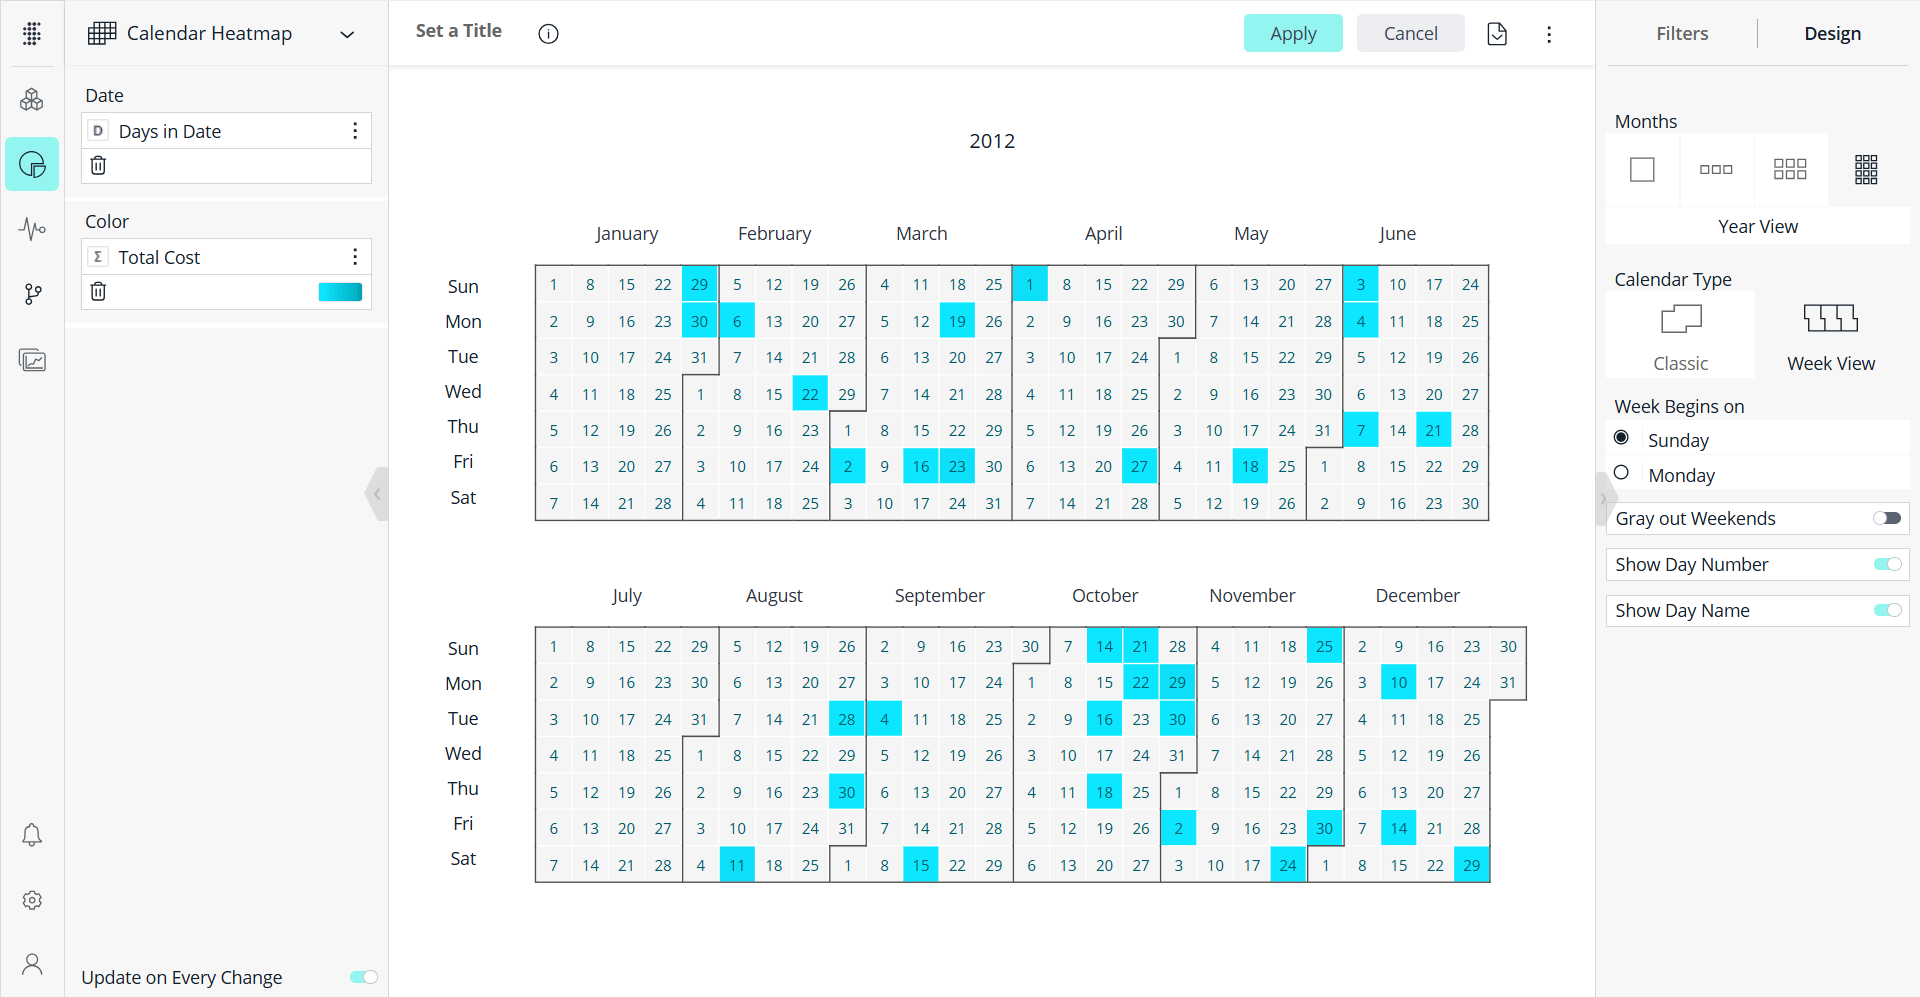
- Months: Select how many months should be presented at once: 1 (One Month View), 3 (Quarter View), 6 (Half-Year View) or 12 (Year View).
When more months exist than currently visible, paging arrows are displayed to move between months.
-
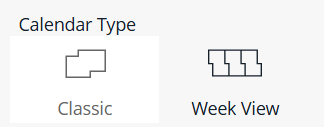
Calendar Type: Select between two types of view modes:
- Classic - Each month is presented in typical calendar format.
- Week View - Months are ordered by weekdays from top to bottom.
-
Week Begins On: Select the first day of the week to be represented in the calendar.
More Configuration Options
- Grey Out Weekends - If on, the weekend days will be colored grey in the calendar.
- Show Day Number - Toggle whether to show the calendar day numbers inside the widget.
- Show Day Name - Toggle whether to show the day name abbreviations on the calendar.
Limitations
-
The calendar heatmap always behaves as a highlight‑only visualization. It does not respond to dashboard slice/filter behavior. Workaround: Use a different widget type (e.g. a table or chart) with the same fields and measures as the calendar heatmap and apply the filter and slice behavior to that widget.