Building Formulas with Functions
Last updated: June 11, 2026
| Tier | Deployment |
|
|
|
You can use functions to build formulas that aggregate, summarize, and accumulate data, plus show changes in data over time.
Combine Data: Aggregate Functions
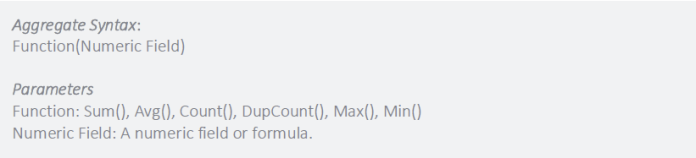
Aggregations are used to perform mathematical calculations on data. This being such an essential function, Sisense offers an advantage in the ability to run multiple aggregations on several fields simultaneously - this makes it easy to summarize data based on multiple factors.
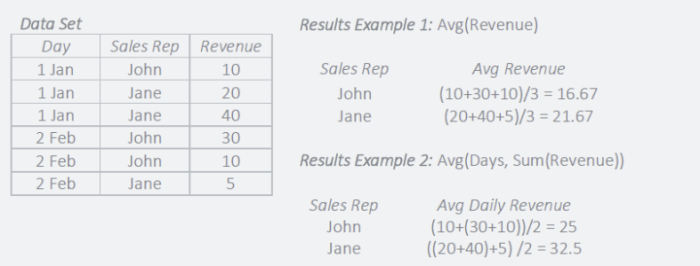
An example of a simple aggregation is a sales manager who wants to calculate the average sales revenue for each sales rep. The manager can create a pivot table, which shows the sales rep and their average sales revenue.
A more complex example is a multi-pass aggregation (or grouping) that is an aggregation that performs multiple calculations simultaneously. Following the first example, assume that the sales manager wants to also see average sales per day for each sales rep. Instead of having to add an additional column for day in the pivot table, the manager can create a multi-pass aggregation that first performs a sum of sales per day and then averages the results for each rep. This requires two fields: a day from a date field and the revenue field, as well as two aggregations: sum of sales and average. The result is that sales manager does not need to add a column for days in the pivot.
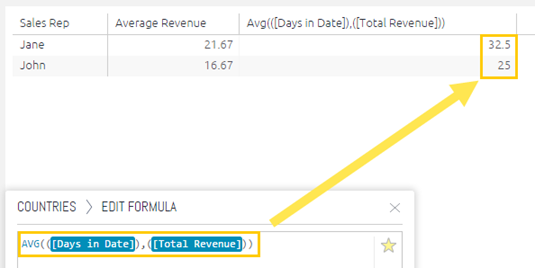
The above example as shown in the formula editor.
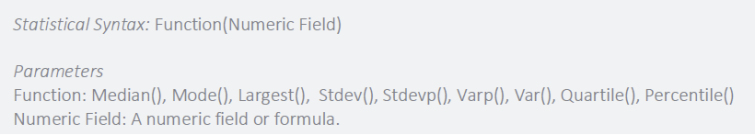
Summarize Data: Statistical Functions
Descriptive statistics provide meaningful summaries of data and help make more informed decisions. This is particularly important for large data sets where descriptive statistics can help to focus analysis.
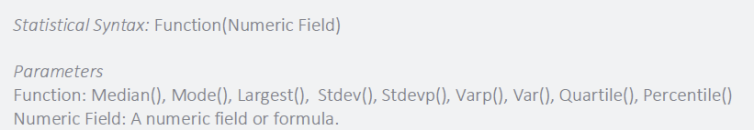
An example of statistical functions is a marketing team that has a large data set on leads generated from various channels and want to understand where to focus their budget. Descriptive statistics can be used to summarize valuable insight about each channel, such as the central tendency or median leads generated, along with standard deviations to assess typical lead volume.
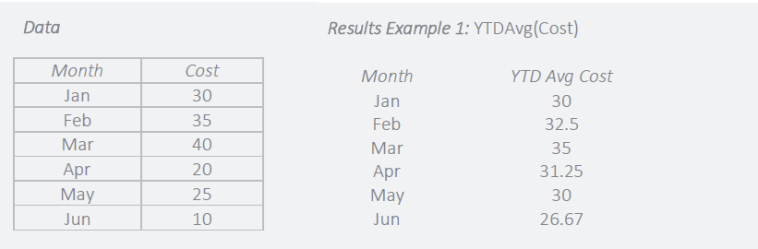
Accumulate Data: Running Total and Average
Often, to measure performance, data must be viewed in a continuous and accumulative format over extended periods such as years, quarters or months. Sisense provides functions to create running totals and averages over standard or custom time periods.
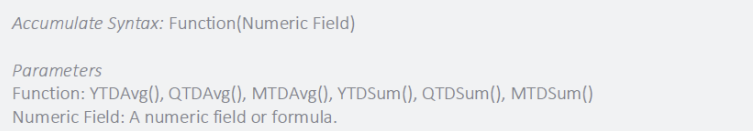
For example, a support team has a goal to reduce the average monthly cost to resolve open issues. A Year to Date Average can be used to track progress towards reducing the average cost of support.
Change over Time: Time Functions
Time is critical for business decisions. Time functions make it easy to compare outcomes at different points in time, determine growth rates and calculate the time differences. Functions can be set for common time periods such as year, month or day, as well as for custom periods.
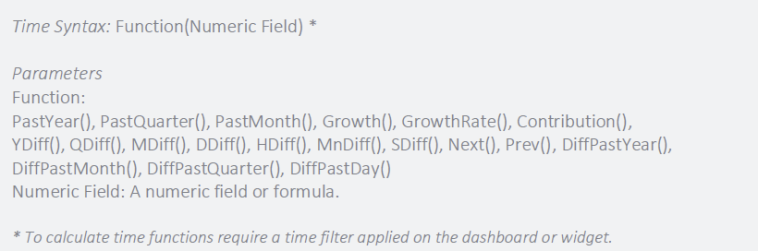
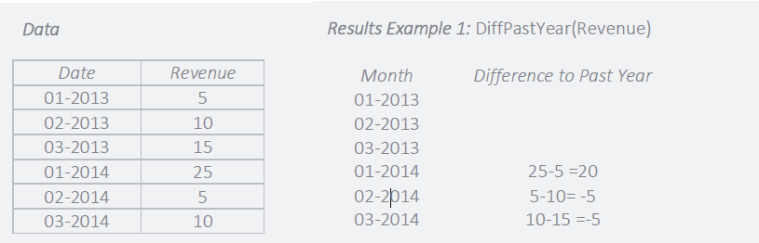
For example, an executive team wants to compare growth in revenue to the same period in the previous year. A Difference in Past Year function can be used to compare past values based on the current month to the same month in the previous year.
Tip:
For more information, see:
on the Sisense Community site.