Augmented Text Deduplication
As your data comes from a variety of sources, many times you need to aggregate the same dimension that is represented differently in each source. In some sources, an attribute can be spelled one way, and in another source, a different spelling. In some cases, attributes may not have been spelled correctly when they were added.
Watch this video about grouping data:
One way to deal with this is with custom SQL CASE statements, for example:
case [Name]
 when 'John Smith' then 'J. Smith'
 case [Country]
 when 'Afrika' then 'Africa'
However, this can be very time consuming and lead to mistakes. Leveraging machine learning, Sisense can analyze your data and group similar dimensions automatically for you.
Sisense analyzes and groups your data from your ElastiCube on the column level. This means that Sisense looks at each column and identifies similar strings, and groups them together into a single attribute.
.png)
All the group's attributes are then added to your data model as a custom table that you can use in your dashboard.
How Does it Work?
After you have imported your data and built your ElastiCube, a list of columns are displayed. For each column with a string data type, you can have Sisense analyze that column and group by similar attributes.
The first time Sisense analyzes the column, you choose how Sisense analyzes it and how inclusive the results should be.
_1252x560.png)
Sisense has three methods for analyzing data:
- Similarity: Sisense applies a soft TFIDF (term frequency-inverse document frequency) algorithm where similar strings are grouped together by rank. Terms that appear too often, such as company and inc are scored lower as they are less unique.
- Spelling: Sisense groups strings similar in spelling.
- Phonetic Similarity: Sisense groups strings terms that sound similar, for example, strings that use 'f' or 'ph'.
Recommendation: Sisense recommends you test each method, and find the results that work best for you.
Next, you select how inclusive the results are. The default is less inclusive, which means it is more precise. The more inclusive the results, the less precision there is. If your results are too inclusive, you may need to spend time editing the members in your group.
- Less Inclusive
- More Inclusive
- Most Inclusive
After analyzing the data according to your settings, Sisense creates a set of groups of similar attributes.
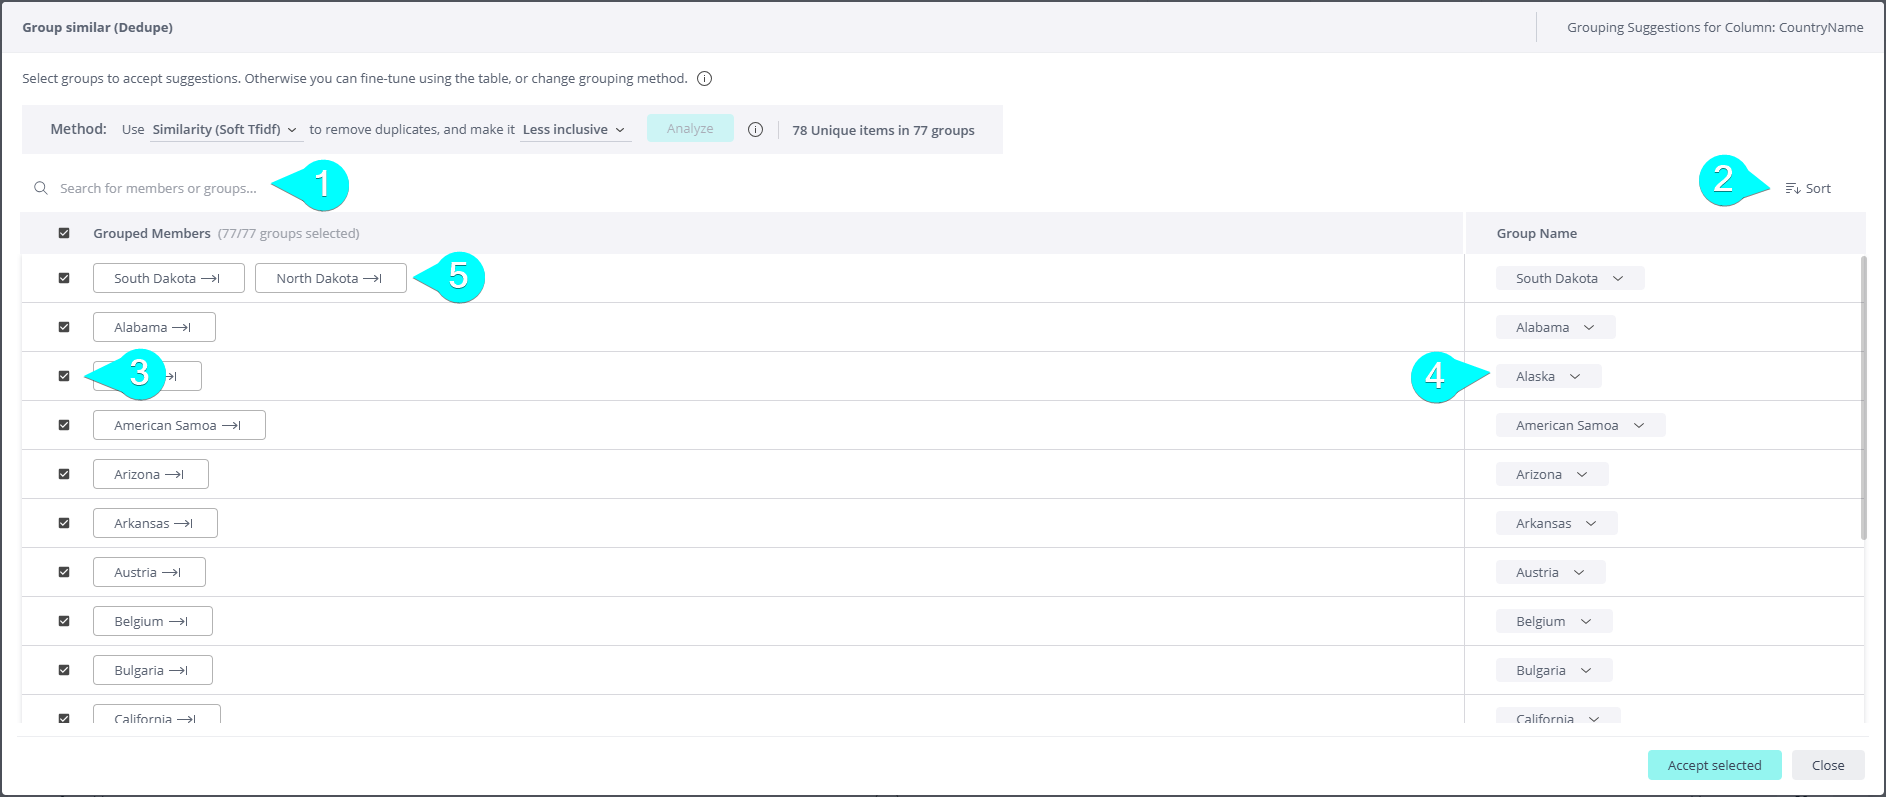
On the left side, are the Group Members. This is a list of members that have been grouped together according to the algorithm. On the right side is the Group Name, or how they should be named. If you think of this as a CASE statement, the members on the left are the conditions, when 'John Smith', and the Group Name on the right is the result, then 'J. Smith'. The group name determines how all the members should be called.
Sisense provides these recommendations based on the algorithm you selected, however, you can move members to different groups. For more information, see Modifying Groups.
Once you are satisfied with your groups, click Done, and Sisense adds a custom table to your data model. Keep in mind that the new table is not included until your next successful build.
Creating Custom Columns with Grouped Data
If you have already built your ElastiCube, you can create custom columns from data grouped together by Sisense.
To create custom columns:
-
Create or open an ElastiCube model.
-
The model must be built before your data can be grouped. If you have not run a build, build the model.
-
In Table view, click the table that contains the column whose data should be grouped.
_326x652.png)
-
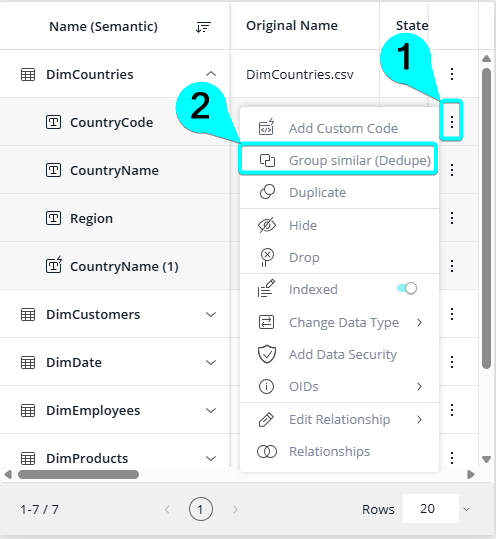
For the relevant column, open the column's menu and click Group Similar (Dedupe).
-
Click Analyze Data and Sisense will analyze the data and display a list of groups. The method Sisense uses by default is to group similar strings and make it less inclusive.
OR
Click Change Grouping Method to modify how Sisense groups your data. After you have selected the relevant method, click Analyze Data.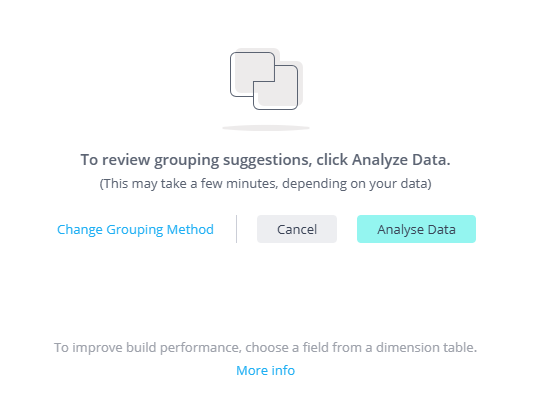
A list of groups and their members are displayed.
-
Modifying Groups the group as required and click Done. A new custom table is added to your data model.
Modifying Groups
Before creating your custom columns, you can modify Sisense's recommended groups manually. The Group Similar window contains a variety of options for modifying your groups.
-
Enter the name of a group or its members to filter the list of members displayed.
-
Click to sort the list of groups by size or alphabetically.
-
Select which members are to be grouped when adding to your custom columns. By default, all groups are selected.
-
Click the Group Name to rename it, replace it with another group, or merge the group with another group. When merging with another group, the members of the first group are added to the group you select. When the column is created, all members receive the group name of the group they are merged to.
-
Click a member to move it to another group or create a new group from that member.
Editing Grouped Custom Columns
After you have created your custom columns, you can edit your groups. Any changes you make to the groups affect the data displayed in your dashboards after your next build.
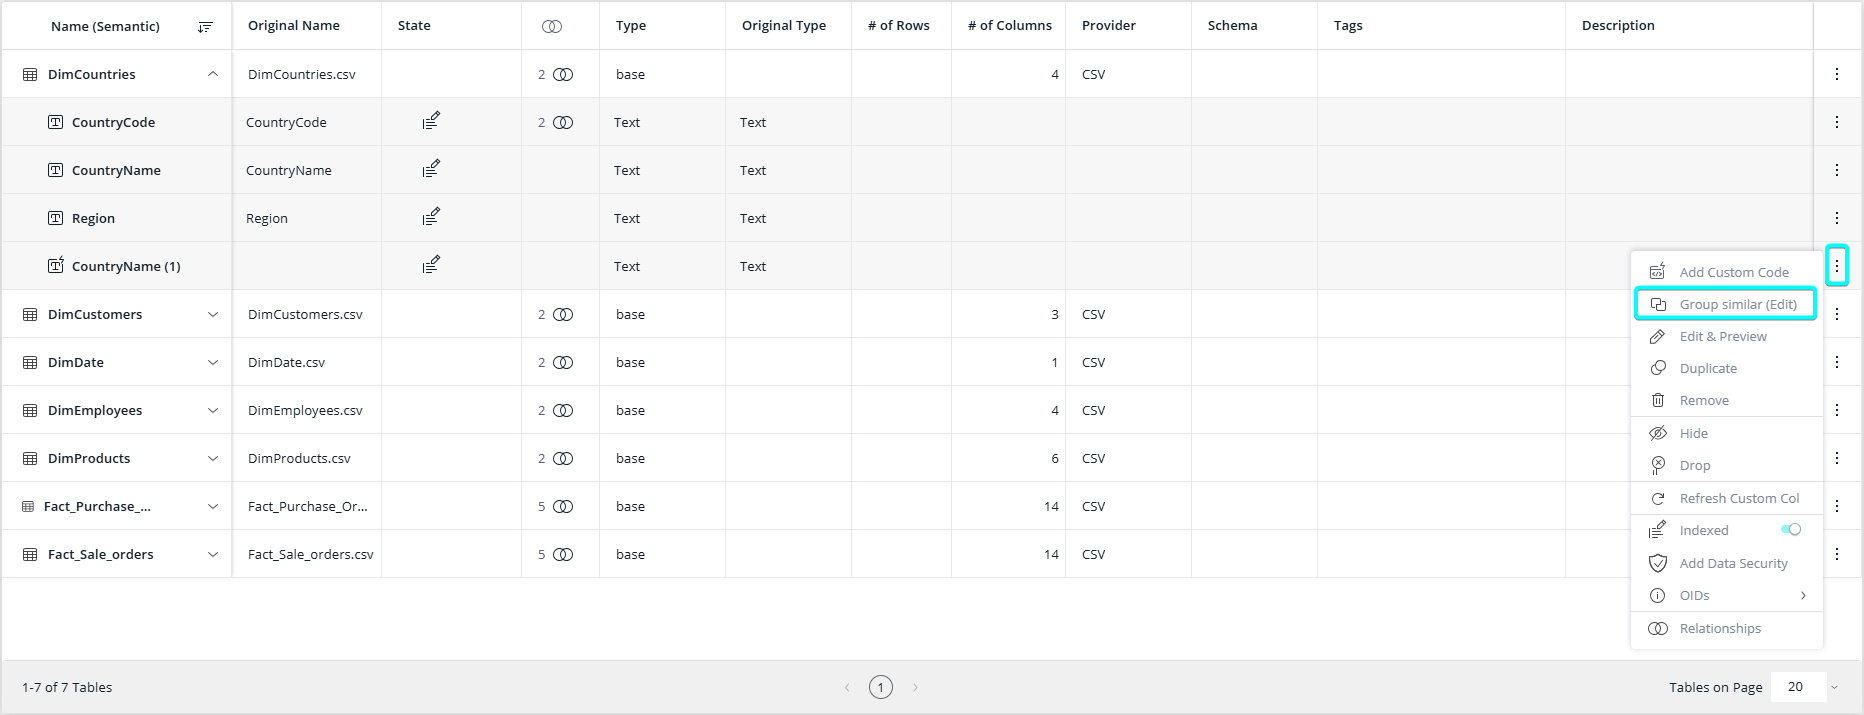
From your ElastiCube model, you can edit the groups by selecting the relevant column and clicking Group Similar (Edit).
Note:
If you edit the table by clicking Edit & Preview, any changes you make are overwritten the next time group your data.
After you click Group Similar (Edit), the Group Similar window is displayed with a list of your groups. You can now modify the groups as necessary. As you make your changes, new values are highlighted in yellow and you can sort.
Limitations
- Sisense supports up to 1000 unique values based on the largest groups.
- Custom columns can be migrated with your ElastiCubes, but if you want to make any changes after migrating them, you must regroup your data from scratch.
- Sisense supports grouping data on tables up to 10 million rows.